Humanity’s appetite for energy remains unappeasable. Consumption trends of this essential resource have remained unwaveringly strong amidst the political-energy crises that shook the world in the late 20th and early 21st centuries (1973, Yom Kippur war; 1979, Iran-Iraq war; 1990, first Persian Gulf war; 2003, second Persian Gulf war) and the great financial crisis of 2008. Only the outbreak of the COVID pandemic in 2020 managed to slightly reverse this growth trend. The figure below shows how the world’s primary energy consumption has changed over the past two centuries, expressed in TWh (1 TWh = 1 billion Wh):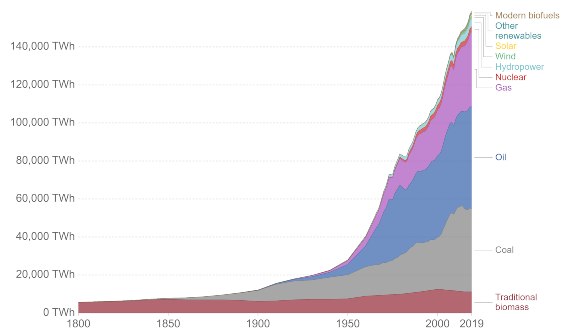
Global direct primary energy consumption (TWh) over the past two centuries.
Image source: Our World in Data
In 2019, consumption stood at approximately 160,000 TWh and, judging by the previous graph, this trend is unlikely to do anything but continue increasing in the near future.
Energy consumption, the best indicator of inequality
To analyze global energy consumption data – or data related to any other magnitude – it is essential to distinguishing between regions, countries, etc. in order to avoid overlooking vital details. In general, these statistics are always conveyed in terms of “average” values, which need to be used with extreme caution, because they tend to conceal significantly different cases. Indeed, as the graph below shows, energy consumption rates per individual and year across the planet are extremely unequal:

Energy use per person in 2019 in all countries in the world.
Image source: Our World in Data
Considering the tones used for each country, the palette ranges from the lightest colors, which indicate consumption levels below subsistence thresholds, to the darker tones, which indicate very high energy consumption levels.
The following figure provides a more detailed breakdown of the previous graph’s data. The vertical axis represents the daily per capita consumption of primary energy in 2019 (expressed in kWh) in the 90 most populated countries on Earth – about half of the existing nations – which account for 90 percent of the world’s population. The horizontal axis shows the per capita GDP of these same countries, measured in 2018 dollars:
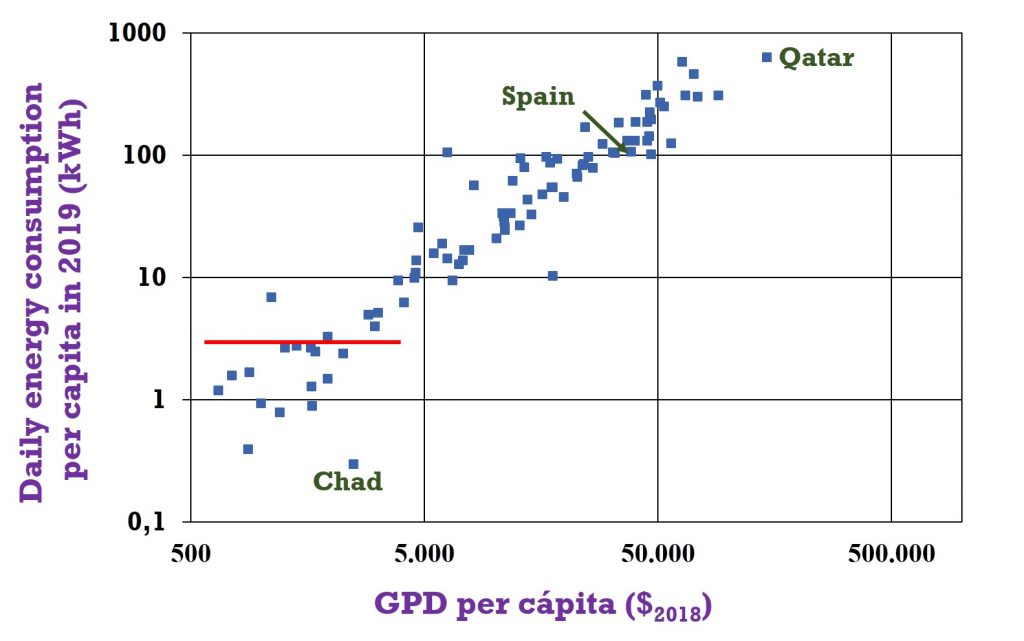
The scales on both axes are logarithmic. The red line indicates an energy consumption of 3.5 kWh per day, which is considered the subsistence minimum. Dotted on the graph is the poorest country on Earth in terms of energy consumption (Chad), the richest (Qatar) and Spain, which belongs to the club of what I call the First Energy World.
Sources: Our World in Data for energy consumption (2019) and the FInternational Monetary Fund for GDP per capita (2018).
The data on the vertical axis show the daily per capita primary energy consumption, taking into account all energy sources. Primary energy is the energy that is transformed into other secondary sources for practical use: electricity, heat, cold, mechanical energy to propel vehicles, etc. In other words, these figures, although expressed in kWh, indicate the consumption of all energy sources available to every citizen in each country (not to be confused with electricity consumption, which only represents 15 to 20 percent of the total energy consumed on a daily basis). The countries with daily per capita energy consumption rates below 3.5 kWh suffer extreme poverty, one of the many adversities they face. About 3,5 kWh per day is deemed as the minimum daily primary energy consumption that any person performing some type of activity needs to survive. The countries where such circumstances exist are the ones included below the red line in the graph.
In terms of per capita energy consumption, the world’s countries can be grouped into four large blocks:
Below 3.5 kWh (extreme energy poverty): Sub-Saharan Africa (Gambia, Sierra Leone, Niger, Chad, Dem. Rep. Congo, Guinea, Mali, Burkina Fasso), as well as certain Asian countries (Nepal, Cambodia).
3.5-50 kWh (high or very high energy poverty): Central America (El Salvador, Guatemala, Nicaragua, Honduras. are the poorest in the group, with 10 to 15 kWh of daily per capita energy consumption), certain countries in South America (Ecuador, Bolivia, Colombia), southern Africa (Mozambique, Angola, Zimbabwe), certain Asian countries (Bangladesh, Pakistan, Afghanistan, Mongolia, Indonesia) and the Middle East (Jordan).
50-100 kWh (countries with medium energy consumption): Europe (Romania, Greece, Hungary, Serbia); Asia (China, Iran); America (Mexico, Argentina, Brazil, Venezuela); Africa (Algeria, Egypt, South Africa)
More than 100 kWh (first energy world): all Western European countries, Oceania, North America (except Mexico), Japan, Russia. The Persian Gulf States (Qatar, United Arab Emirates, Bahrain, Kuwait, Saudi Arabia) deserve special mention: average daily consumption rates exceed 250 kWh per day in all cases. Thus, it can be said that energy consumption in these last two groups could be considered actually shameful (especially in the Persian Gulf states, where we can speak of extreme energy waste).
The world’s average per capita primary energy consumption is 60 kWh, 17 times higher than the minimum subsistence threshold, which, as mentioned above, is estimated at 3.5 kWh. Considering a global population of about 7 billion human beings, these figures show that, if consumption levels were more equitable, the current level would be enough to cover the energy needs of about 120,000 million people. In this light, the energy problem stands not as a resource scarcity issue, but rather a problem of wasteful use and enormous inequality in the global distribution of consumption, as the richest 20 percent of the world’s population is responsible for 80 percent of all primary energy consumption.
The differences between the richest citizens on the planet and the poorest are simply outrageous. The following Table shows the per capita GDP to per capita energy consumption ratios, dividing the figures corresponding to each term by for the average Qatari citizen by those of an average Chadian. According to the preceding graph, Qatar has the is the world’s richest country by GDP per capita, and has the highest per capita daily energy consumption level; Chad is the planet’s poorest country in terms of per capita energy consumption:

Quotient between GDP per capita for an average citizen of Qatar and one from Chad (second column) and the same quotient for the daily per capita energy consumption of two citizens of the same nationalities (second column).
While the disparity in terms of GDP is enormous, in terms of energy consumption it’s just mind-boggling: a Qatari citizen consumes more than 2,000 times the energy consumed by a Chadian every day. The daily energy consumption of the average Qatari is enough to cover the bare minimum needs of 180 people, while that of an average Chadian is about ten times lower than the daily minimum energy subsistence threshold.
In short, energy is one of the indicators that best quantifies inequalities across the planet. Now that the world is in the midst of an energy transition towards more sustainable sources compared to those that prevailed over the past two centuries, this issue should be considered with a view to mitigating, in as far as possible, the above mentioned inequalities.
Ignacio Mártil
Professor of Electronics, Universidad Complutense de Madrid
and member of the Spanish Royal Physics Society
Comments on this publication