One of the moments most valued by astronomers is twilight. As the Sun sets, the sky darkens and the first stars are seen. At first there are two or three, but as the minutes go by they become more and more visible; the first to appear will be the brightest stars of the night, the last, the dimmest. But their brightness is not the only thing that differentiates the stars. As the night progresses and the sky darkens, if we look closely, we will see stars of red, white and blue… Stars have colours, and learning about them takes us on a fascinating journey through their lives.
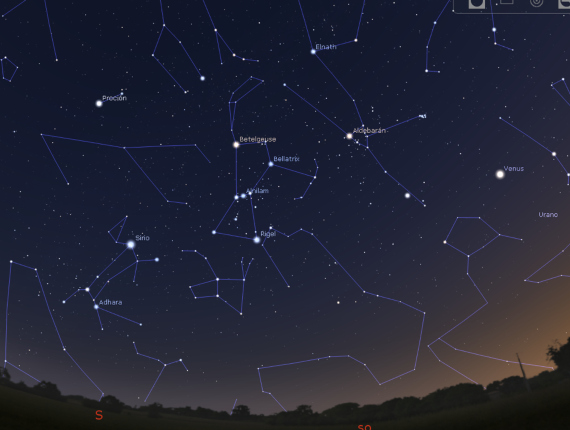
During these early spring weeks, it is easy to locate the constellation of Orion, along with Canis Major and Taurus, shortly after sunset. At first sight, the stars might appear to have the same colour, but if we seek out a dark sky and take a second closer look, we will notice different colours. Sirius (in Canis Major) is white, Rigel (Orion’s right foot) is blue, Aldebaran (in Taurus) is orange and Betelgeuse (Orion’s left shoulder) is red.
In the home of the astrophysicist, the taps are reversed
The fact that stars come in different colours is not a mere curiosity. The colour provides a fundamental piece of data in stellar astrophysics—the surface temperature of the star. The hottest stars are blue and the coldest are red, contrary to the use of colours in art and in our daily experience. This is why it is often said that in the home of the astrophysicist, the taps are reversed: blue indicates hot and red cold.
The Morgan-Keenan star classification is based on the colours of stars, ranging from the bluest (most energetic) stars to the red (weakest) ones, via the types O B A F G K M. As a mnemonic rule, the phrase Oh Be a Fine Girl(Guy), Kiss Me is often used to remind us of them —a classic joke in faculties around the world where astrophysics is taught.
The star classification also usually indicates the absolute brightness of stars. It is important to qualify this usually, as we will see a couple of exceptions later. Blue stars tend to be the brightest, and red stars the dimmest. But more experienced observers will encounter red stars at night that are brighter than white or blue ones. How is this possible? It should be remembered that, when observing from the Earth, the stars are at different distances. Thus, a red star that shines faintly but is very close will appear to shine more brightly than a blue star that is much further away.
Apart from the temperature and brightness, the colour also usually —with the same qualification— indicates the size of a star: the hottest and most energetic blue stars are usually bigger and the red ones smaller.
A star diagram
Knowing that by the colour of a star you can estimate its surface temperature and usually know its brightness and size, astronomers Ejnar Hertzsprung and Henry Norris Russell put these characteristics into a graph known today as the Hertzsprung-Russell diagram, which they both developed independently around 1910.
On this H-R diagram, the vertical axis orders the types of stars from faintest to brightest, while the horizontal axis orders them from hottest to coolest, taking into account their temperature, colour and stellar classification. The result is a diagonal grouping that orders the stars by these characteristics: this part of the diagram is called the main sequence.
Most of the stars are in the main sequence. They shine thanks to the nuclear fusion reactions in their core, which convert hydrogen into helium. These stars are at the stage in which they are mature and spend most of their active lives. Put into human terms, the main sequence would be the stage ranging from teenagers to reaching retirement. Our Sun appears to be near the midpoint of that stellar lifespan: it is a medium G-type yellow star.
The periodic table of the stars
Stars can shine for billions of years, but nothing lasts forever. The fuel that they use for nuclear reactions is limited and eventually runs out. When there’s no hydrogen left to burn, helium fusion takes over, but unlike the previous stage, this one is much more energetic. This causes stars, reaching the end of their lives, to swell to thousands of times their original size, becoming giants. The expansion also causes them to lose heat on their surface, as they have to distribute more energy over a larger area, and that is why they turn red. These red giant stars are an exception and are located in the upper right part of the diagram, known as the red giant zone.
The red giants don’t last long (on a stellar scale) and quickly exhaust what little fuel they have left. When this happens, the star runs out of the nuclear reactions in its interior that used to sustain the star; gravity then pulls on its entire surface and shrinks the star down to a dwarf. Due to this brutal compression, the energy is concentrated and its surface increases in temperature, radically changing its brightness to white. The corpse of a star is called a white dwarf. These stellar corpses are another exception to the main sequence and are located in the lower left of the diagram.
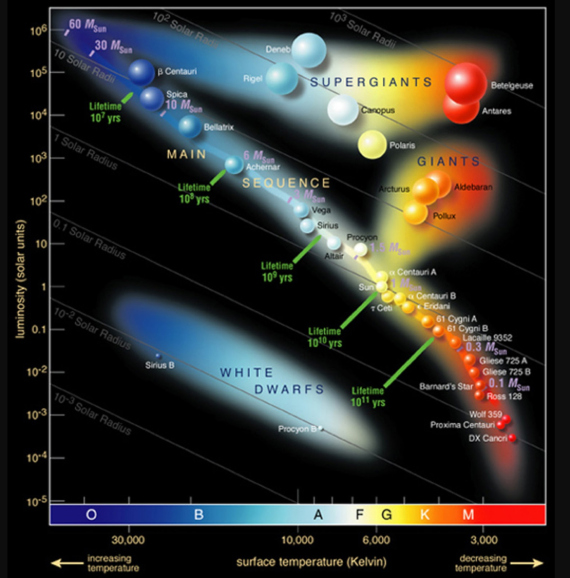
Without a doubt, one of the greatest achievements of science is the periodic table of elements. One might say that the Hertzsprung-Russell diagram is the periodic table of stars. In its complete form, it may look somewhat like a strange and deformed rainbow; however, once we know how to read it, we can see how the different colours of the stars relate to their temperature, size, brightness and phase of stellar life, distributed in an orderly and elegant way. It is a wonderful treasure map for astronomy fans: the key to jumping into another dimension, both in the knowledge of the cosmos and in the ability to enjoy the beauty of the firmament.
Comments on this publication