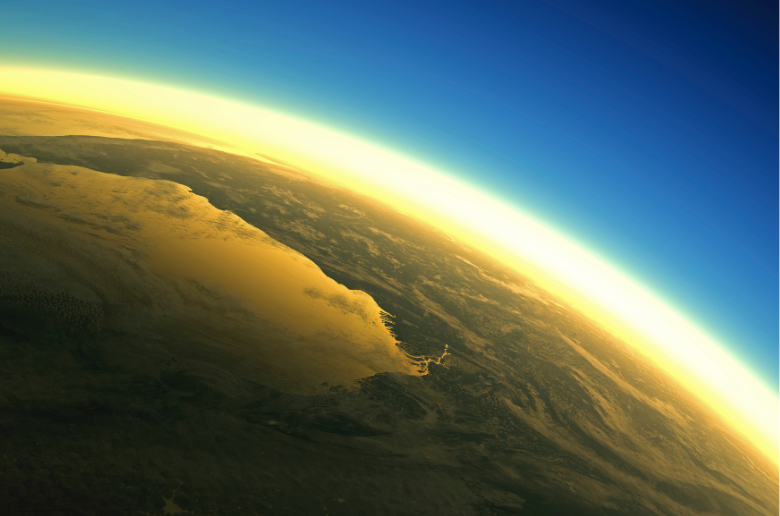
Every year, the 3rd of March is World Wildlife Day, established by the United Nations in 2014 to commemorate the signing of the Convention on International Trade in Endangered Species of Wild Fauna and Flora (CITES) in 1973. This day reminds us that nature is not only valuable in itself, but that we depend on it.
In 2009, a group of scientists led by Johan Rockström of the Stockholm Resilience Centre and Will Steffen of the Australian National University defined a framework for measuring our impact with indicators for nine processes, nine planetary boundaries, beyond which the Earth’s capacity for self-regulation is exceeded and its habitability compromised. The most recent analysis, in 2023, concluded that we have already crossed six of them. We review them here, from those where we are still within the safety margin to those where we are living beyond the planet’s means.
Stratospheric ozone depletion
The planetary boundary where we are most comfortably within the safe operating range is the level of stratospheric ozone. The Montreal Protocol banning chlorofluorocarbons came into force in 1989. Since then, the depletion of the ozone layer has gone down. The safe level set by scientists is 276 Dobson units (DU), allowing a <5% reduction from pre-industrial levels of 290 DU. We are currently at 284 DU, although levels are lower over Antarctica in the austral spring.
Atmospheric aerosol loading
This indicator refers to atmospheric pollution that affects climate and rainfall patterns. Natural pollution has doubled since 1750, mainly due to Saharan dust. The quantity of aerosols in the atmosphere is measured by the reduction in sunlight reaching the surface, resulting in a measure of aerosol optical depth (AOD). The planetary limit is set at 0.25 and globally we are at 0.14, still in the safe range, although it is much higher in specific regions, for example 0.4 in eastern China.
Ocean acidification
We are also still within the safe range for ocean acidification, but only just. Scientists use the concentration of carbonate at the sea surface as an indicator: the lower the value, the more acidic the ocean. The pre-industrial level was 3.44, and the established limit is 80% of that, around 2.75. We are currently at 2.8, although scientists warn that it is getting worse as CO2 emissions increase.
Changes in land use
For the other parameters, we have already exceeded the safety margin. To assess land-use change, scientists look at the percentage of forest cover remaining today compared to pre-industrial times, with a global boundary of 75%, broken down to 85% for boreal and tropical forests and 50% for temperate forests. Today we are at 60% on the global indicator, and the authors warn that deforestation has increased in most regions since the previous assessment in 2015.
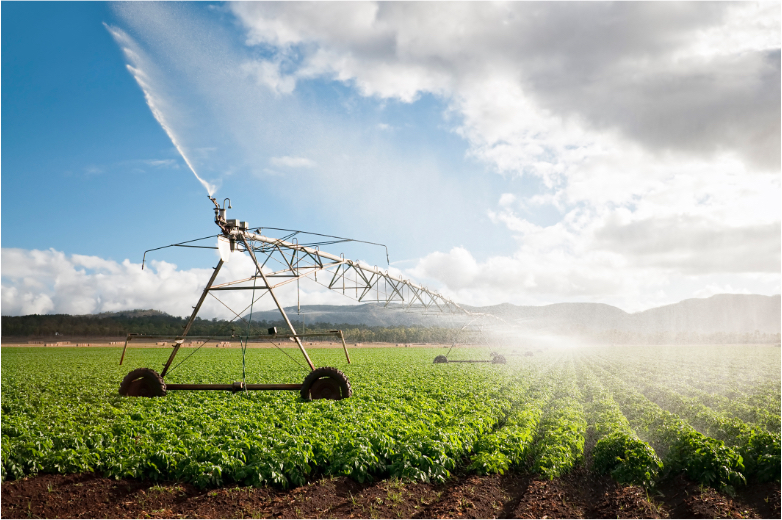
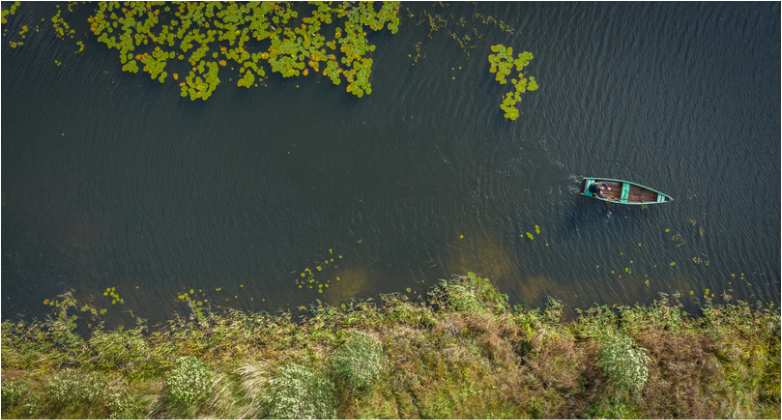
Freshwater change
In terms of freshwater, the scientists assess the disruption to the flow of blue water (surface and groundwater) and green water (plant available water) by analysing the global area of land where these natural flows have been altered. In both cases, we already exceeded the boundary at the beginning of the 20th century; the current values are 18% for blue water, above the permitted boundary of 10%, and almost 16% for green water, above the 11% limit.
Biogeochemical flows
This indicator measures the disruption of global element cycles, currently focusing on nitrogen (N) and phosphorus (P), the building blocks of living organisms, whose cycles have been altered by agriculture and industry. For N, its incorporation into the agricultural system is measured in teragrams (Tg, million tonnes) per year; we are at 190, three times the boundary of 62. For P, its global discharge from rivers into the oceans is analysed, and by region in terms of fertiliser applied to agricultural soils. For the former, we are at 22 Tg per year, twice the boundary of 11; for the latter, the current figure is 17, almost three times the boundary of 6.
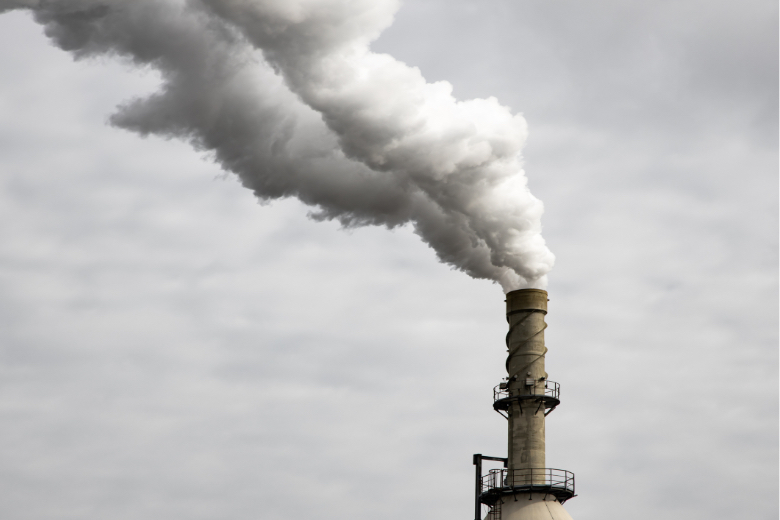
Climate change
When it comes to climate change, it is clear that we are living far beyond the planet’s capacity. Scientists quantify two measures: the atmospheric concentration of CO2 in parts per million (ppm) and changes in the proportion of solar energy absorbed by Earth. For CO2, we are currently at 417 ppm, above the 350-ppm boundary that would keep global warming to 1.5°C, according to the 2015 Paris Agreement. For solar absorption (radiative forcing), the limit is 1 watt per square metre, and the current level is 2.91.
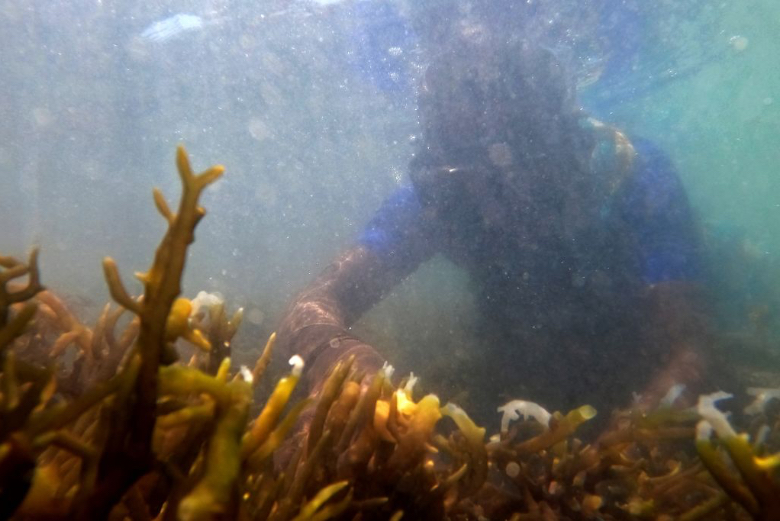
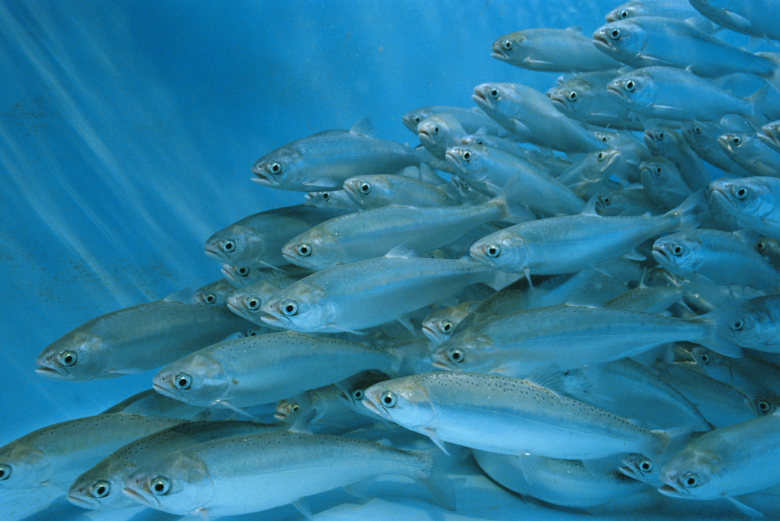
Integrity of the biosphere
With this concept, the authors of the planetary boundaries take the pulse of the health of terrestrial biodiversity by assessing two parameters. Genetic diversity is expressed as the rate of extinctions per million species-years. The upper limit is set at 10, although scientists warn that it should be lowered to 1; we are currently at least above 100, although the real figure could be much higher. The second parameter, functional diversity, is more complicated and reflects the proportion of energy and biological material available to ecosystems minus the proportion appropriated by humans. We should be satisfied with using less than 10%. We crossed this threshold at the end of the 19th century and now use 30%.
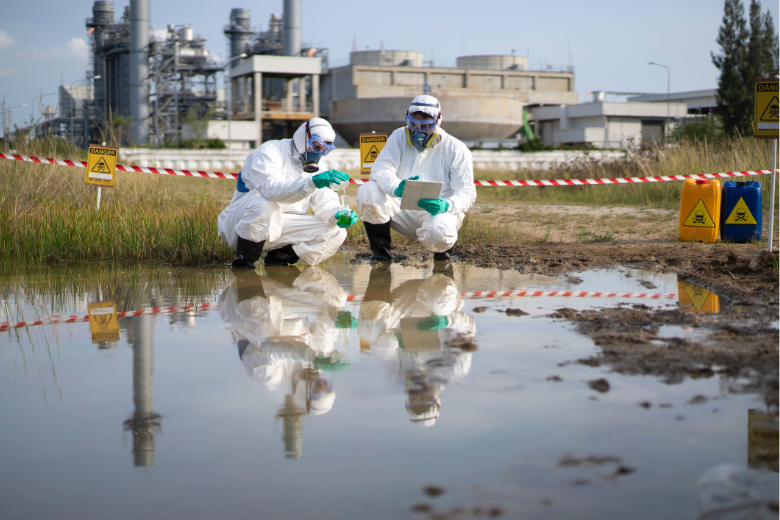
Chemical pollution
Finally, this boundary defines the discharge of all kinds of pollutants whose harmlessness to the environment has not been established. Scientists are clear: it should be zero. And although it is very difficult to quantify the proportion of these discharges, one estimate calculated that around 80% of the chemicals registered under European regulation had not passed adequate safety tests to rule out environmental impact.
Comments on this publication