Modern production requires increasing use of intangible assets such as computerized information, innovation-generating activities, and organizational capital. Investments in these assets have been growing rapidly over the past few decades. They represent a greater share of aggregate economic activity in the United States than in Europe, although some European countries such as Sweden invest more than the US. Intangible assets are an important contributor to raising labor productivity growth, both directly through increasing capital per worker and indirectly through changing production practices. However, there is evidence that they are associated with a reduced return to labor, especially for workers with skills below university level.
Introduction
Funding from the European Union Framework Programmes for Research has led to a greater understanding of the magnitudes of the role of intangible assets in explaining economic activity.
In recent years there has been considerable interest, both in the academic and policy communities, in evaluating the impact of investments in intangible assets on economic activity. These investments have not generally been well measured in official economic statistics, with only a few asset types, such as software and artistic originals, and more recently research and development expenditures, currently included in national accounts. Intangible assets have often been described as the “missing input,” whose inclusion in economic statistics might affect performance at the aggregate economy, sector, or firm level. Recently, an extensive research effort has been put in by economists to measure the value of intangibles, their growth over time, and their impact on productivity, as reviewed below. Less research has been carried out on their impact on labor markets or on the type of work carried out in firms, so the evidence presented is more limited.
This chapter first reviews the literature on measuring intangibles, at both the aggregate economy and industry levels. It then presents evidence on intangible capital’s impact on productivity, including some recent work at the firm level. This is followed by a discussion of the extent to which intangibles substitute or complement different types of workers. The chapter reports on some recent work examining the impact of intangibles on aggregate labor’s share of GDP.
The research reported in this chapter owed considerably to the willingness of the European Commission Framework Programmes to fund cross-country comparative research, first at the aggregate economy level in the projects COINVEST and INNODRIVE, at the industry level in the project INDICSER, and for the public sector in the project SPINTAN.1
What Are Intangible Assets?
Investment in intangible assets are expenditures by firms on activities that raise future output but have no physical substance.
Investments in intangible assets are widely recognized as major determinants of innovation, growth, and employment in the “knowledge economy.” The pioneering work on measuring intangibles was by Corrado, Hulten, and Sichel (2005, 2009), hereafter CHS, who addressed the conceptual problem of defining intangible assets using an inter-temporal framework. These authors concluded that “any use of resources that reduces current consumption in order to increase it in the future qualifies as investment.” In this analysis they argue that all types of capital, intangibles as well as tangible assets such as structures and equipment, should be treated symmetrically. CHS developed expenditure measures for intangible investment in the United States, classifying intangible capital into three broad categories: computerized information, innovative property, and economic competencies. At that time only software and artistic and entertainment originals were recognized as assets in official guidelines for national accounts. Since then, the national accounts fixed asset boundary has been expanded to include R&D, as set out in the System of National Accounts 2008. The pioneering measurement effort for the US by CHS broadened the scope of intangible assets to include a greater range of asset types and, in turn, spurred a research effort to measure these assets and their impacts for a larger group of, mostly developed, countries—see Corrado et al. (2017a) for a review.
Computer software together with large databases have been recognized as intangible fixed assets in national accounts since the mid-1990s, while R&D was added recently
Table 1 summarizes the CHS list of intangible assets, dividing into the market sector (on the left) and the nonmarket (public) sector (on the right). Computer software together with large databases were recognized as intangible fixed assets in national accounts since the mid-1990s. Research and development, defined as the value of expenditures that lead to an increase in the stock of knowledge, was added recently, as noted above. Non-national accounts intangibles include innovative property, other than R&D, designed to capture a range of assets that may have intellectual property protection associated with them, for example design rights. Economic competencies, instead, aim at capturing a range of knowledge assets that firms invest in to run their businesses, but that might have no intellectual property rights. These include the costs of marketing and launching new products, including ongoing investments to maintain the value of a brand, and firm-provided human capital in the form of training (CHS, 2005, 2009).
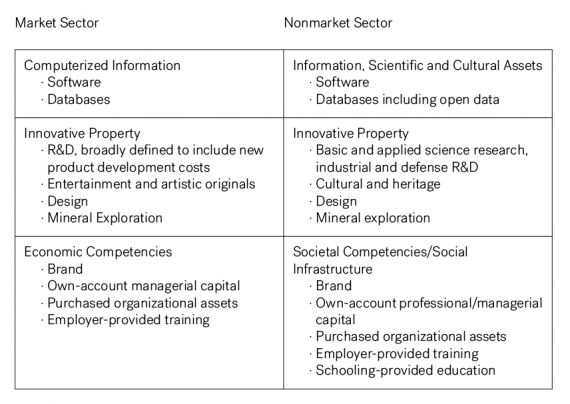
Table 1. Classification of intangible assets. (Source: adapted from Corrado et al. [2017a], table 1.)
Economic competencies also include organizational capital which is conceptually more complex and has a different characterization according to whether we refer to the business or public sectors. Organizational capital is the cumulated knowledge that is built up in firms through investment in organizing and changing the production process. These investments can be purchased externally by the firm, by spending on management consultancy, or can be produced within firms, known as own account. CHS see own-account organizational capital as knowledge produced by persons in authority in a firm (managers), which yields a firm specific capital good jointly produced with output, and embodied in the organization itself. In the public services there may be other high-level employees who also possess authority, and so the definition of own-account organizational capital needs to be broadened to include some professionals such as senior doctors, who have the specific knowledge to set goals and the authority to ensure they are implemented.
There are many similarities in the types of assets in the business and public sectors, as described in Table 1. While the character of some assets is rather different when produced by public institutions, for example public investments in brand include information on health and safety, this is not so different from investments in activities that promote new products in private firms. Likewise, computer software, purchased investments in organizational capital, and employer-provided training are similar in the two sectors. As well as the differences in organizational capital referred to earlier, open data and cultural assets need to be added. Open data refers to information assets in the form of publicly collected data for general use, such as spending on statistical agencies, the weather service, and so on. Cultural assets are public intangible assets whose services are used in production in cultural domains as defined by the UNESCO Framework for Cultural Statistics.
From 1995 to 2015, Sweden had the highest share of intangible investment in GDP, relatively higher than the US and France (which had a similar share to the US). The intangibles shares were particularly small in Spain and Greece
How Important Are Intangible Assets?
Intangible assets represent a greater share of GDP in the US than in the EU.
Data on intangible investments by asset type are publicly available2 and have been described and analyzed in a series of papers (see Corrado et al., 2013; 2017a; 2017b). Figure 1 shows the share of each asset in total intangibles for the market for the United States in 2015. Software and databases accounted for 17% of total intangible investments. Innovative properties accounted for 38% overall. Within this group R&D has the largest share, but artistic originals and mineral oil exploration and design also have significant shares. The remaining 45% is accounted for by economic competencies with organizational capital representing more than half of this group.

Fig. 1. Shares of intangible assets by type, US, 2015. Asset types: softdb (software and databases); minart (entertainment, artistic and literary originals + mineral explorations); design; nfp (new product development costs in the financial industry); rd (research and development); brand; org (organizational capital); train (firm-provided training). (Source: www.intaninvest.net.)
The data for the market sector shows that the average share of intangible investment in GDP across the period 1995 to 2015 was relatively higher in the US (14%) than in the average across EU countries (10.5%). However, there is significant variation within the EU. Figure 2 shows that the intangibles share tends to be significantly higher in northern and central European countries, than in southern and eastern countries. Sweden had the highest share of any individual country, surpassing the US, with France having a similar share to the US. The intangibles shares were particularly small in Spain and Greece. Corrado el al. (2016) show that the investment gap between the EU and the US is more related to the lower contributions of computer software and databases, artistic originals, mineral exploration, brand and training than to the contribution of R&D.
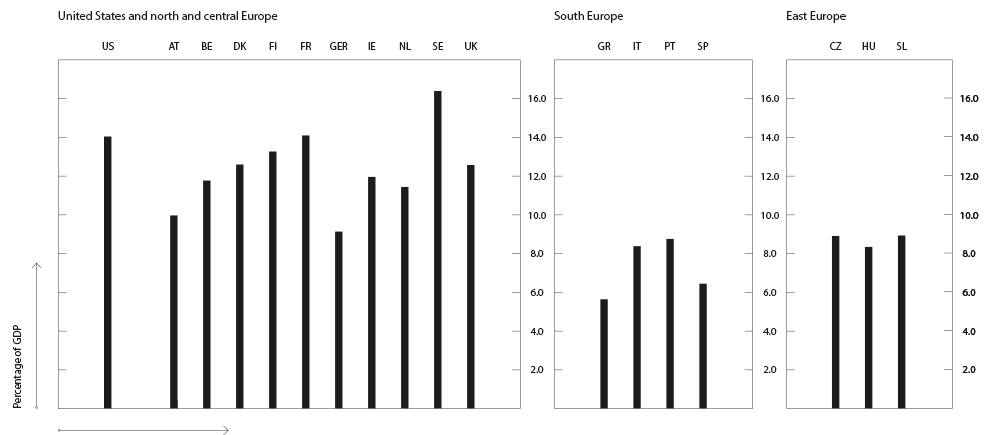
Fig. 2. Intangible investments as a share of GDP, market sectors, average 1995–2015. Countries: US: United states; AT: Austria; BE: Belgium: DK: Denmark; FI: Finland; FR: France; GER: Germany; IE: Ireland; NL: the Netherlands; SE: Sweden; UK: United Kingdom; GR: Greece; IT: Italy; PT: Portugal; SP: Spain; CZ: Czech Republic; HU: Hungary; SL: Slovenia. (Source: www.intaninvest.net.)
Finally, the constructed datasets also show that the market sector dominates and accounts for the lion’s share of intangibles in all countries covered. The GDP share of intangible investment in the nonmarket sector accounted for 1% of GDP in EU countries, on average, in 2010, contrasting with the about 10% of GDP for the market sector. In the US the share of GDP of nonmarket intangibles was 2.6% at the same time, so there was an American lead also in nonmarket intangibles. The evidence suggests that the most knowledge-intensive economies, the UK and Sweden, experienced faster accumulation of intangibles in the nonmarket sector compared to most of the other EU countries.
Intangible Assets: Impacts on Productivity
Intangibles have a large impact on raising output per worker, both directly through providing more capital per worker, and indirectly through knowledge spillovers on productivity.
One of the motivations for constructing measures of intangible assets at the aggregate economy level was to try to explain differences across countries in productivity growth—in particular why the US experienced a productivity upsurge in the decade from 1995 which was not matched in Europe; see Timmer et al. (2010) for a discussion of comparative productivity trends during this period. Here we distinguish between the growth in labor productivity (output per worker-hour) and total factor productivity (TFP) which is defined as output growth minus the weighted growth of labor and capital inputs.
Corrado et al. (2013), using a growth accounting framework,3 show that, over the period 1995–2007, intangible capital accounted for 28% of labor productivity growth in the US, compared to 23% in the EU. Within Europe, intangibles accounted for close to the US percentage points in the UK and Nordic countries, but was significantly lower in Spain and Italy. Their results show that intangibles can explain some of the growth gap between the US and Europe during this period, but most of the gap remains unexplained. The contribution of TFP to labor productivity growth was nearly 40% in the US compared to only 19% in the EU. In a more recent paper Corrado et al. (2016) provide growth accounting evidence before and after the great recession in 2008–09. The major findings were that tangible investment fell massively during the great recession and has hardly recovered, whereas intangible investment has been relatively resilient. Intangible investments recovered fast in the US but lagged behind in the EU. However, their analysis shows that since the great recession, the slowdown in labor productivity growth has been driven by a decline in TFP growth with relatively minor roles for both tangible and intangible capital.
The major findings were that tangible investment fell massively during the great recession and has hardly recovered, whereas intangible investment has been relatively resilient
An issue with the growth accounting framework is that it cannot account for any impacts of intangible capital directly on TFP. This relates to an earlier literature, based on evidence at the firm level, that suggested that gaining benefits from new technologies, such as information and communications technology (ICT), required significant additional investments in research, training, and organizational changes, which are part of intangible investments. Therefore, an examination of these interactions required researchers to go beyond growth accounting and instead use an econometric approach. These efforts investigated the presence of knowledge externalities, often called spillovers, that are suspected if the estimated marginal product of a factor exceeds the marginal product implied by the factor remuneration under competitive markets. Knowledge generated by the use of intangible capital has benefits above those accruing to the owners of those assets.
Using data for the market economy for thirteen countries, Roth and Thum (2013) suggest that, once accounting for business intangibles, the combined impact of greater capital per worker-hour, which includes both tangible and intangible capital, becomes the dominant source for explaining labor productivity growth, with a diminishing explanatory power from TFP growth. In econometric production function estimates, these authors report a coefficient on intangible investment of about one-quarter—this turns out to be much higher than the coefficient identified by this asset’s factor share in growth accounting.
A first attempt to produce internationally comparable estimates of intangible investments at the industry level was undertaken by Niebel at al. (2014). The growth accounting estimates by industry suggest that the importance of intangible capital assets by type varies across sectors, with R&D the most important asset in manufacturing whereas organizational capital dominates in many service sectors. In terms of contributions to labor productivity growth, however, there appear to be common sectoral patterns across countries, with high investment in all sectors in some countries (the UK and the Netherlands) and low investment in others (Italy and Spain). The paper performed an econometric estimation of the relationship between indicators of intangible capital and labor productivity growth at a sectoral level. This confirms the positive impact of intangible capital on economic performance as found by previous authors. However, the paper estimates an impact of intangibles, ranging from 10% to 17%, which is much lower than the coefficients using aggregate data. This finding suggests that unexplained heterogeneity at the macro level is likely to account for this difference and such biases are partially addressed using industry data. Nevertheless, these estimates remain higher than average growth accounting impacts, consistent with spillovers from this asset type.
Knowledge generated by the use of intangible capital has benefits above those accruing to the owners of those assets
Corrado et al. (2017b) also find large magnitudes for the impact of intangible capital. Their results strongly support the possibility of productivity spillovers. Moreover, they find evidence of a complementarity between intangible and ICT capital—the output elasticity of intangible capital depends upon ICT intensity. Therefore, it appears that returns to ICT depend crucially on the presence of “unmeasured” intangibles.
Another group of studies examined productivity at the firm level, using information on occupations of different types of labor (e.g. IT workers, R&D staff, and managers) to measure intangible investments. Looking across sectors, the association between R&D intangible assets and productivity was found to be positive in many industries, but appears particularly strong in mining and quarrying, and high-technology manufacturing. IT capital provides a significant and positive contribution across all sectors. Organization capital has a significant and positive contribution in nearly all sectors. In more mature, low technology manufacturing sectors (such as wood products or textiles), where R&D is not as significant, organizational capital is particularly important. This illustrates these sectors’ reliance on achieving economic performance increases through process innovation rather than technological innovation (Riley and Robinson, 2011).
Overall these research efforts point to an important role of intangible capital in facilitating increases in labor productivity and TFP growth. With greater amounts of intangible capital to work with, output per hour of employee time is increased, and the additional knowledge generated and reorganization of production processes increases underlying productivity. However, this does not tell us much about the use of different types of labor, their employment and the returns they receive in the labor market. We now turn to this important issue.

Intangibles and the Labor Market
Intangible assets appear to substitute for labor overall, with those with low-skill levels most adversely affected.
In their recent book, Capitalism Without Capital: The Rise of the Intangible Economy, Haskel and Westlake (2018) point to a major shift in the way modern firms do business. Much investment is now in the form of intangible assets, but do these assets complement or substitute for labor? The answer is that we do not know but the available evidence suggests that overall labor may have lost out from this phenomenon. Traditionally economists studied the substitution/complementarity relationship by estimating production functions, employment equations or labor share of value-added equations, where the latter takes account of both impacts on earnings and employment. Difficulties in measuring intangible assets until recently implied there was very little direct evidence of the interactions between this type of capital and labor.

O’Mahony et al. (2019) is one of the few papers that directly looks at the impact of intangible capital on labor’s share of value added. Using panel data for industries and countries, and the data constructed by Niebel et al. (2014) referred to above, they suggest that overall the impact is to lower labor’s share, suggesting intangible assets substitute for labor. When intangibles are divided into innovative property and economic competencies, however, these interactions become more complex. While investments in innovative property such as R&D appear to complement labor, the much larger investments in brands, firm-provided training, and organizational capital appear to substitute for labor. The authors also divide labor into those with high-level skills—university degrees and equivalents—and all other workers. Intangible capital affects these two types of labor in different directions, complementing the higher-skill workers and substituting for other workers. The former can be seen as a continuation of skill-biased technical change which was shown to be a significant driver of inequality between workers in a vast number of studies, stemming from the wave of technological changes related to ICT. While ICTs require specific high-level skills in their implementation, it is not so immediately clear why intangible assets should do so.
In the case of firm-provided training, there is ample evidence that this is most likely to be provided to workers who already possess high-level skills—see O’Mahony (2012) for a detailed examination of this intangible asset by country and sector in Europe. The direction of the effect for investing in organizational changes is not clear but we might expect that implementing changes would increase the demand for generic skills in communication and team working that are commonly associated with university level qualifications, and reduce demand for workers who do not possess skills compatible with new production methods.
Brand development is one way that firms can ensure they capture a greater share of their market pies. If correct, this development is likely to lead to greater disparity between workers and owners of capital, and above all adversely affect the bargaining power of lower-skilled workers
The impact of brand development is more nuanced. There is a growing body of literature that suggests that profits have been rising, especially for firms in high-tech sectors which are those most likely to be investing in intangible capital. This literature suggests that it is not so much a question of substitution of capital for labor but rather an increase in markups or profits that reduce labor’s share. Brand development is one way that firms can ensure they capture a greater share of their market pies. If correct, this development is likely to lead to greater disparity between workers and owners of capital and especially adversely affect the bargaining power of lower-skilled workers who are more easily replaced by technology.
Overall, the impact on labor markets of the growth in intangible capital is likely to have been associated with greater inequalities, between the high skilled and those with lower skills and between the owners of capital and workers. The important question for policy is will this persist? It may be that we are in a period of transition to new forms of production requiring new skills and competencies which become embodied in labor and raise that input’s return in the long run. A less sanguine scenario is that these increased investments have led to a period of concentration of production in the hands of very large firms, increasing profits for the few, at the expense of wages for the many. Only time will tell if the more optimistic or pessimistic scenarios will prevail.
Notes
Bibliography
—Corrado, Carol, Hulten, Charles, and Sichel, Daniel. 2005. “Measuring Capital and Technology: An Expanded Framework.” In C. Corrado, J. Haltiwanger, and D. Sichel (eds.), Measuring Capital in the New Economy, Chicago, IL: University of Chicago Press, 11–46.
—Corrado, Carol, Hulten, Charles, and Sichel, Daniel. 2009. “Intangible Capital and U.S. Economic Growth.” Review of Income and Wealth 55: 661–85.
—Corrado Carol, Haskel, Jonathan, Jona-Lasinio, Cecilia, and Iommi, Massimiliano. 2013. “Innovation and Intangible Investment in Europe, Japan and the United States.” Oxford Review of Economic Policy 29: 261–286.
—Corrado, Carol, Haskel, Jonathan, Jona-Lasinio, Cecilia, and Iommi, Massimiliano. 2016. “Growth, Tangible and Intangible Investment in the EU and US Before and Since the Great Recession.” In Investment and Investment Finance in Europe. European Investment Bank Report, 73–102.
—Corrado, Carol, Haskel, Jonathan, Iommi, Massimiliano, Jona-Lasinio, Cecilia, Mas, Matilde, and O’Mahony, Mary. 2017a. “Advancement in Measuring Intangibles for European Economies.” EURONA : Eurostat Review on National Accounts and Macroeconomic Indicators 2: 89–106.
—Corrado, Carol, Haskel, Jonathan, and Jona-Lasinio, Cecilia. 2017b. “Knowledge Spillovers, ICT and Productivity Growth.” Oxford Bulletin of Economics and Statistics 79(4): 592–618.
—Haskel, Jonathan, and Westlake, Stain. 2018. Capitalism without Capital: The Rise of the Intangible Economy. Princeton: Princeton University Press.
—Niebel, Thomas, O’Mahony, Mary, and Saam, Marianne. 2014. “The Contribution of Intangible Assets to Sectoral Productivity Growth in the EU.” Review of Income and Wealth 63: 49–67.
—O’Mahony, Mary. 2012. “Human Capital Formation and Continuous Training: Evidence for EU countries.” The Review of Income and Wealth 58(3): 531–549.
—O’Mahony, Mary, Vecchi, Michela, and Venturini, Francesco. 2019. “Technology, Intangible Assets and the Decline of the Labor Share.” ESCoE Discussion paper, available at https://www.escoe.ac.uk/wp-content/uploads/2019/06/Mary-OMahony_Technology-Intangible-Capital-and-the-Decline-in-the-Labor-Share.pdf.
—Riley, Rebecca, and Robinson, Catherine. 2011. “Skills and Economic Performance: The Impact of Intangible Assets on UK Productivity.” UK Commission for Employment and Skills, Evidence Report 39.
—Roth, Felix, and Thum, Anna. 2013. “Intangible Capital and Labor Productivity Growth—Panel Evidence for the EU from 1998–2005.” Review of Income and Wealth 59: 486–508.
—Timmer, Marcel, Inklaar, Robert, O’Mahony, Mary, and Van Ark, Bart. 2010. Economic Growth in Europe. Cambridge: Cambridge University Press.
Comments on this publication