Technological change is making it harder to interpret disappointing productivity figures in many economies. Although there are likely to be many contributory factors, such as post-financial crisis debt overhang and demographic change, technological change complicates the interpretation of the evidence in two ways. One is the delay between companies adopting new technologies and their impact on productivity because of the organizational or management changes and the complementary investments that are also needed. The other is the mismatch between how official GDP and productivity figures are defined and the character of the digital economy, such as zero price, advertising-funded services, or the switch to cloud computing. A more fundamental question is whether “productivity” is a useful concept in economies consisting to such a large extent of services and intangibles.
Productivity matters because over the long run it is the measure of how much more effectively a society can turn its available resources into valued goods and services. Stated in this general way, it is the ultimate indicator of progress; and, indeed, productivity growth at “modern” rates significantly above zero began with the Industrial Revolution. However, measuring productivity is not straightforward, and linking its behavior to the underlying drivers still less so. Since the mid-2000s there has been a slowdown in trend productivity growth in many OECD economies, often described as the “productivity puzzle” precisely because its causes are not understood—and particularly because the pace of innovation in fields including digital, biomedicine, and materials appears to be at last as rapid as ever (fig. 1).
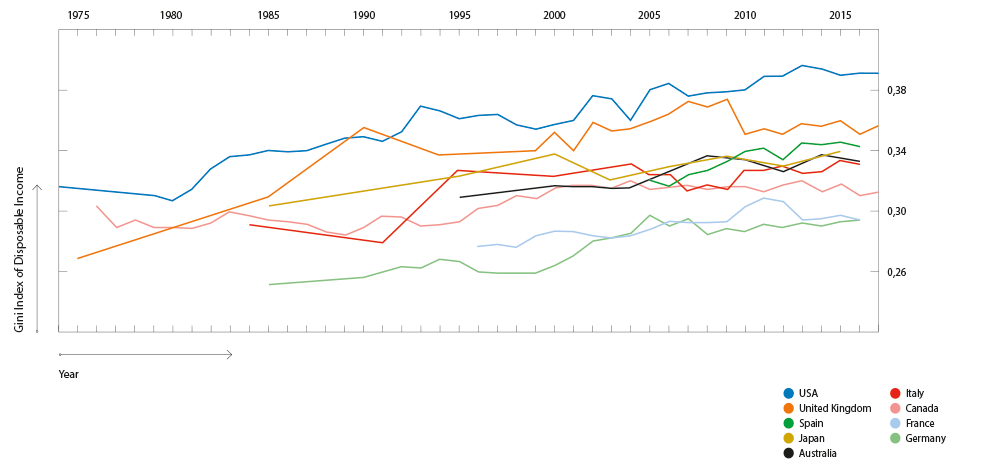
Fig. 1. Labor productivity growth 1970–2018, selected countries (Source: https://stats.oecd.org)
The standard approach is “growth accounting,” the attribution of real terms of GDP growth to growth in measured inputs of capital and labor and a residual, known as multifactor or total factor productivity (TFP) growth.1 TFP is where technological progress, innovations enabling more output for the same inputs, ought to show up. However, the measured residual also includes the effects of failing to measure all inputs well, or omitting some of them. Over time the measurement of capital and labor inputs has become more sophisticated, with adjustments for the skill level of workers, for example, or the introduction of some types of intangible capital. These improvements chip away at the unexplained residual, which Moses Abramovitz famously labeled “the measure of our ignorance.”2 For example, a recent literature has identified the importance of management quality for productivity at the firm level.3 If it were possible to include an aggregate measure of national management quality in the growth accounting exercises, as a form of intangible capital, this would reduce measured TFP.
Its residual character thus makes TFP somewhat unintuitive. A more intuitive, and more easily measured, alternative is labor productivity. This is simply real GDP per hour worked. It also makes it easier to see the role of technology, as embodied in capital equipment. For example, a construction worker becomes more productive not by digging faster with a shovel or taking fewer rest breaks, but by having a mechanical digger to work with instead. So we should expect periods of technological change to manifest themselves in faster labor productivity growth as well as faster TFP growth.
However, whichever is selected, productivity measures now pose a puzzle. Although the pace of innovation continues, on the face of it, to be very rapid, all measures of productivity growth have slowed significantly, particularly since the mid-2000s. In the UK, where the slowdown has been particularly marked, the level of labor productivity is about one-fifth lower than it would be had the pre-crisis trend continued. But labor productivity growth has slowed everywhere across the OECD.
Any complex phenomenon will have a number of contributory factors, and in this case the drawn-out effects of the financial crisis on firms’ investment spending, decreasing competition in key economic sectors, or adverse demographic change in the OECD countries are all plausible parts of the productivity story.4 Still, there is a striking paradox in the combination of seemingly rapid innovation in a number of technological fields—advanced materials, biomedicine, green energy, autonomous vehicles, small satellites, the “Fourth Industrial Revolution” in manufacturing—and dismal productivity figures. The media and bookshops are full of warnings about the likely effect of the next wave of robotics on jobs, but there is absolutely no sign yet of the robot apocalypse as that would certainly have boosted the labor productivity figures.
Since the mid-2000s there has been a slowdown in productivity growth in many OECD economies, a trend often described as the “productivity puzzle”
There are three potential explanations for this paradox.
One prominent perspective is that it is more apparent than real, and that, in fact, there has been far less technological innovation than the hype would lead us to believe. Robert Gordon is a forceful advocate of this view. In his book The Rise and Fall of American Growth he argues that the technological innovations of the early to mid-twentieth century, such as indoor plumbing, electricity, or the initial communications technologies of telegraph, telephone, and radio, had profoundly more important economic consequences than today’s incremental improvements in digital entertainment or the digitalization of existing services and products. While Gordon has a narrow focus in terms of today’s frontier technologies, his argument has had some support from recent estimates of a sharp decline in research productivity.5 It is not only Moore’s Law that is showing signs of running out of steam; the number of researchers in the United States is more than twenty times greater now than in the 1930s, and yet there has been a long-run trend decline in TFP growth for some forty years now.
The technological innovations of the first half of the 20th century had profoundly more important economic consequences than today’s incremental improvements in digital entertainment or the digitalization of services
Not surprisingly, given the range of innovations reported currently, the technology community is dismissive of the claim that the pace of change is slowing. It is hard to evaluate the claim that there are severely diminishing returns to new ideas. Part of the impact of new technologies may never be measured or measurable. For instance, if today’s renewable energy technologies enable the decarbonization of electricity generation, this will represent a profoundly important innovation that will never be captured in GDP or productivity measurement because the carbon externalities are not included. A discovery like the use of mini-aspirin doses—a cheap and old compound—to help prevent cardiovascular illness will extend many lives but hardly affects the growth statistics at all.
In general, GDP as a value-added measure does not reflect well innovations that improve the efficiency of production processes, as opposed to innovations that give rise to new products or services; few statistical agencies calculate the relevant gross output deflated by the appropriate input and output prices at each stage of the production chain. Over the past twenty years or so there has been a major reorganization of business globally creating extended international supply chains, with each stage more specialized than previously. Adam Smith’s insight about the gains from specialization has been taken to the global scale. Yet trend productivity growth has slowed in the OECD nations spearheading this phenomenon, which can be thought of as a significant process innovation—for if it were not benefiting companies in some way, why would it have become so pervasive? This is in effect to restate the productivity puzzle, but it suggests a shortfall in our understanding of the economic processes—and measurement, including how to take proper account of the use of intermediate inputs to production.
A second possibility is that the current wave of innovation in many fields will increase the productivity growth rate—eventually. However, important innovations can take a long time to lead to the changes in firms’ activities and consumers’ behavior that are reflected in economic transactions and hence the GDP and productivity statistics. Economic historian Paul David provided a canonical example of the long delays between innovation and productivity outcomes in his 1999 study of the adoption of electricity in the early twentieth century. Not only was new infrastructure needed for distribution networks; as David pointed out, crystallizing the benefits of electricity also required major investments such as new low-level factory buildings configured for assembly lines in place of old mills built over several stories around their steam engines’ drive shafts. Additionally, getting the full benefit of the assembly line required innovations in management techniques and workflow organization. In that case the lag between original innovations and full productivity impact was some fifty years.6
Research on the initial wave of the digital revolution also highlighted the importance of management and organizational change, leading to either delays, or even failure on the part of some firms to gain any productivity benefit from their investments in information and communication technology equipment. In their survey of this evidence, Erik Brynjolfsson and Lorin Hitt described this as a role for a form of intangible capital, which they argued was many times more important than investment in ICT equipment, and extended over about a decade before it showed up in productivity improvements.7 For example, businesses could hold lower stocks of inventories, requiring changes in logistics chains and practices. Workers needed to have more flexible job responsibilities and more autonomy to take decisions on the basis of information that could now flow to them faster and more cheaply. In their study of the US productivity boom of the late 1990s, McKinsey also highlighted the role of logistics and inventories, finding that Walmart alone had a measurable impact on the aggregate figures.8
Similarly, additional complementary investments may be needed to reap the benefits of some current technological innovations. Obvious examples are autonomous vehicles requiring significant infrastructure investment and institutional changes in law and insurance products; renewable energy requiring major investment in the distribution and transmission networks; or management and work practice changes in “Internet of Things” production and service provision, as well as extensive investment in 5G communications. In recent work on the importance of intangible investments such as business process redesign, new business models, or additional investments in human capital for the use of technologies such as artificial intelligence, Erik Brynjolfsson and his colleagues characterize this as a “productivity J curve,” whereby innovation leads to lower productivity before any improvements are observed.9 Some of the current much-hyped innovations, such as AI and machine learning systems, or the Internet of Things, are anyway not yet as widely deployed in business as headlines would suggest so it remains to be seen if they will live up to expectations. Others—such as computing, discussed below—are widely used, however.
GDP as a value-added measure does not reflect well innovations that improve the efficiency of production processes, as opposed to innovations that give rise to new products or services
The final possible explanation concerns the difficulty in measuring productivity. This line of explanation also has its skeptics. A number of studies have explored the potential for measurement error and concluded that, if anything, the measurement difficulties were even greater before the mid-2000s, so this argument deepens the productivity puzzle. Byrne, Fernald, and Reinsdorf correct US productivity figures for several biases such as the need to quality-adjust prices for ICT equipment, and the need to measure intangible investments better, and yet conclude the measurement challenges are no worse than they used to be so cannot explain the observed slowdown.10 Looking specifically at the prices used to deflate nominal GDP, Reinsdorf and Schreyer find that there has been meaningful overstatement of prices and therefore understatement of real output and productivity, but again conclude that this was a bigger problem in the past.11
However, others (including me) conclude that there remain some significant measurement challenges, across a range of factors affecting either real GDP and productivity, or indeed our broader understanding of the structure of the economy. These challenges include the following.
Some of the current much-hyped innovations, such as AI and the Internet of Things, are not yet as widely deployed in business as headlines would suggest so it remains to be seen if they will live up to expectations
Free Digital Goods
The treatment of digital goods that are free to consumers poses an obvious issue for GDP statistics, which are intended to measure total monetary transactions in the economy. What should be done about transactions where no money is changing hands, with consumers paying, instead, in attention and data? The issue is the same as with advertising-funded free-to-air television, but the scope in the economy is wider now. Ignoring the goods is not an attractive option because there is some substitution between free and paid-for digital goods—for example, a service like Spotify has both free and subscription options for the same service, differing only in the advertisements in the former case.

One possibility is to think of these advertising-funded zero price goods as a sort of barter transaction. Consumers are paid in free digital services in exchange for seeing advertising; households produce “viewership services” that they barter for useful digital services or entertainment. Advertisers in turn pay for the content of these services. One estimate of the contribution these barter transactions make to GDP suggests it would have added a tenth of a percentage point to US real GDP growth from 1995 to 2014, with a very modest acceleration post-2005. In other words, the effect on productivity measurement is small and does not help account for the slowdown.12
An alternative is for statisticians to attempt to estimate directly the value consumers gain from these free goods. Erik Brynjolfsson and his coauthors have used the kind of contingent valuation methods previously widely applied to non-monetary environmental goods, and find that consumers (in the US) attach high values to some free digital goods. The authors suggest adding these values to GDP in order to calculate a monetary economic welfare measure, their argument being that the technique provides an estimate of the consumer surplus (welfare gain in excess of the price paid) for these goods.13 The method has attracted interest and is currently being applied in other countries and repeated for the US, not least to test its robustness.
The number of researchers in the United States is more than twenty times greater now than in the 1930s, and yet there has been a long-run trend decline in TFP growth for some forty years now
More recently, however, this approach has been challenged. While agreeing that willingness to pay type methods can provide an estimate of the value of free digital goods, Heys et al. argue that these are most appropriately regarded as intermediate inputs into household production—for example using Google Maps allows faster provision of transport services when driving to the shops—and therefore add value outside the market in the household account rather than adding value to the marketed economy GDP is intended to capture.14
At present, then, there is no consensus about the best approach to measuring this undoubtedly important economic activity, and the proposals have rather different implications for measuring real GDP and productivity.
Crossing the Production Boundary
As this latter argument suggests, one of the consequences of digitalization is the increased scope of activities crossing the “production boundary,” whereby transactions previously involving monetary transactions in the market economy and GDP are substituted by activities within households, which are unmeasured. Such substitutions across the production boundary occur constantly: this present digitalization shift is a mirror image of the shift out of household activities into marketed ones in the postwar era, as women increasingly took paid employment and bought in services or conveniences as substitutes for unpaid domestic labor—a transition that may have flattered measured productivity growth in the 1960s and 1970s. Examples of digital shifts from market to household sector include online banking or travel booking (rather than going to the high street), “volunteer” production such as uploading entertaining videos or posting open-source software, or some “sharing economy” activities. In the absence of updated time-use data, which would enable the development of household account statistics for digital activities, it is hard to know the scale of this shift.15
Price Deflators
There are significant challenges in calculating price indices for sectors experiencing substantial digitally enabled innovation, and it is highly likely that some price indices are overstated, and therefore real output and productivity are understated. For example, telecommunications services appear to be one of the slowest-growing sectors in the UK post-2005. But the previous price index for the sector had taken no account of the massive improvements in quality, such as improved compression techniques, faster data speeds, reduced latency. Even a modest improvement in the price index could turn a zero decrease in prices over five years as recorded by the official index into a decline of more than one-third. Further methodological improvements, reflecting the vast increase in the volume of telecommunications traffic, point to even more dramatic price declines in the sector.16 Similarly, calculating the price businesses pay for computing services to reflect the progressive switch to cloud computing would indicate substantial declines in the relevant price index.17
In general, well-known challenges in constructing consumer price indices when there are innovative and new goods are particularly acute in the digital economy.18 There is a considerable literature looking at how to adjust for quality improvements in technology goods such as computers or smartphones or software. William Nordhaus pointed out the difficulty of measuring the price over long periods of time of radically changing technologies such as lighting or computing power, because prices are attached to specific products, whereas what people get value from is a more fundamental service embodied in different products.19 He calculated the supply side cost of providing these basic goods—although his method cannot tell us how much value consumers attached to each successive embodiment of lighting or computing. Similar challenges could even apply to deflators for other sectors, including “old economy” ones such as construction, as new methods are incorporating features such as digital sensors, improving the performance along dimensions such as energy efficiency, reliability or reduced maintenance, none of which is captured in the deflation of nominal output. The standard theoretical approach of hedonic adjustment (taking account of certain measurable quality improvements) is not widely applied by statistical offices and also faces both practical and methodological hurdles.20 Finding methods for calculating more accurate deflators, in ways statistical agencies can apply in practice, is another active area of research.21
Changing Business Practices and Intermediate Goods
Changes in business practices are making the measurement of sectoral productivity and international trade statistics more challenging. Cloud computing is one example. Its price has declined dramatically since the launch and rollout of these services by Amazon Web Services and others some seven years ago. Firms substitute from investment in fixed capital equipment (servers, etc.) to the purchase of cloud services which are cheaper, higher quality, more secure, and constantly being upgraded. Using cloud services is, in measurement terms, similar to an operational lease on capital equipment owned by another firm. The business investment and output statistics are based on surveys in which firms report their capital and operational expenditure. Use of the cloud means a switch from the former to the latter, with the cloud providers undertaking the investment expenditure instead. It is in any case not clear that the large US-domiciled cloud providers who are market leaders (Amazon Web Services, Microsoft, Google, IBM) report their investment spending to statistical authorities in the separate national markets. What is more, in calculating sector multifactor productivity, without an adjustment for the purchase of capital services from cloud providers, the productivity of the cloud users will be overstated and that of the cloud providers understated.22 As for the trade statistics, while it is reasonably straightforward to measure imports of ICT equipment, it is tricky even to conceptualize all the cloud service flows, such as when a German automaker organizes its global supply chains and production via use of cloud services from a US-based company with data centers in multiple countries.23
A similar example is the case of “factoryless manufacturing,” whereby firms retain intellectual property and customer relationships but contract—often overseas—all the manufacturing activity, relying on digital communications and modern logistics. In general, trade figures are hard to interpret as innovative firms digitally transmit their IP such as blueprints and designs across borders (retaining ownership) in non-recorded data flows. Meanwhile, the products resulting from this IP are recorded in trade figures. Furthermore, some big firms thought of as manufacturers may be classified as distributors, with some evidence that the size of the manufacturing sector, often of particular interest to policy makers, is understated. Existing business surveys do not capture the scope of factoryless manufacturing (and similar models such as toll processing), but novel web scraping methods suggest that about 18% of firms in some sectors of UK manufacturing, and 14% in the case of the US, use contract manufacturers.24
The well-known challenges in constructing consumer price indices when there are innovative and new goods are particularly acute in the digital economy
Data
Pervading many of these challenges is the treatment of data. In the current framework, only a small component of the accumulation of data is currently incorporated into GDP (namely the costs of digitizing and managing a database). Given the explosion of the acquisition, use and transmission of data, and the increasing tendency of firms to treat both own-account and purchased data as a strategic asset, the current practice with respect to investment in data seems too restricted.25 Yet at present there is no consensus about how to conceptualize, measure, and value the flows of data of different types, and the cross-border aspect of data flows in many of the business models described above—and others based on data including the free digital goods models described above—makes these issues all the more challenging.26 While there are standard physical measures of the volume of data in computing terms (Gigabytes, Zettabytes, etc.) and of communication channel capacity, the economic value will depend on the information content. The economic characteristics of data make the valuation particularly difficult because, although there are some market transactions in data allowing prices to be discovered, data is a non-rival, public good with externalities, meaning there is a wedge between market valuation and economic welfare. The national accounts are concerned mainly with market transactions but the wider context is important for economic policy. This is another area of active research including an international debate focused on the national accounts about taxonomies and classification.27
The business investment and output statistics of firms are based on surveys in which they report their capital and operational expenditure. Use of the cloud means a switch from the former to the latter, with the cloud providers undertaking the investment expenditure instead
Classification and Data Collection
Cutting across these conceptual measurement issues is the need for innovation in the collection of the raw data used to construct GDP and productivity measures. The classification structure for economic statistics in terms of industrial sectors and occupations has not kept up with new activities and new skills, still reflecting the manufacturing-heavy economy of the 1940s despite subsequent updates, and at present omitting altogether some industries of interest to policy makers. For instance, sectors such as video games have grown in importance but are hard to track in the existing statistics, and occupational categories are shifting rapidly. New methods such as web scraping are being tested as an alternative to the traditional survey-based data collection methods.28 An additional problem stems from the extended production supply chains noted above. For example, many manufacturing services are understandably classified in the service sector rather than manufacturing, but with insufficient granularity so the size of the manufacturing-centric part of the economy is easily understated. One study suggested that the “true” size of the UK’s manufacturing sector could be understated by up to a half by counting specialist service activities outsourced from manufacturing in with services such as retail or accountancy.29
It is certain that new data sources and methods will be needed to develop more accurate measurement of output and productivity, reflecting the structure of modern economies. Great strides are being made in using novel big data methods, such as extended use of scanner data to improve price indices,30 web scraping and other novel online data such as text or listings,31 “big data” datasets recording massive individual transactions or linkages,32 and satellite data.33 The UK’s Office for National Statistics has established a Data Science Campus to develop innovative methods. Yet initiatives such as these are in their infancy, and far from being systematized by statistical offices.
Conclusions
This list of measurement artifacts and challenges, extensive as it is, may not in the end add up to a significantly different aggregate productivity picture, given other important contributory drivers of the long-term trends. Even so, there is a growing volume of research into economic statistics, much of it due to the digital revolution; some of the issues listed above will be addressed in the upcoming periodic revision of the international System of National Accounts. Yet the fact there are so many measurement issues raises the more fundamental question of whether “productivity” is the best way to conceive of how well the economy is progressing. After all, the OECD economies consist for the most part now of services, not products.
In the current framework, only a small component of the accumulation of data is currently incorporated into GDP (namely the costs of digitizing and managing a database)
As long ago as his 1994 Presidential Address to the American Economic Association, Zvi Griliches observed that “our measurement and observational tools are becoming increasingly inadequate in the context of our changing economy.”34 Labor productivity had flatlined in what he then considered “unmeasurable” sectors of the economy: construction, trade, finance, other services and government. In the subsequent twenty-five years, the scope of the “unmeasurable” has extended. Not only do some of those original unmeasurables account for a greater share of GDP in many OECD economies, but in addition some of the previously “measurable” sectors, including communication and manufacturing, are giving more trouble. One of Griliches’ examples was pharmaceuticals, and the difficulty of treating generic and new drugs prices adequately in constructing a price index and hence real output of the sector; while it is relatively straightforward to measure the number of pills being taken or shots being given, biomedical innovation means the health outcomes per product are dramatically improved. The GDP statistics were developed in an era of mass production and consumption, so are harder to interpret for the present era of highly differentiated services.35
This points to one of two substantial difficulties with the current measurement framework, which is what “real terms” output means. The idea of deflating nominal GDP is to remove the part of the expansion of the dollar or euro total due simply to inflation by calculating what amount of output would leave people with the same level of utility as before. There is a vast literature on price indices concerning how best to achieve this constant utility ideal. But it is, needless to say, a heroic abstraction at the best of times. And when there is rapid innovation and quality change, there is no satisfactory conceptual solution. Economists often think that the statistics simply need “hedonic” adjustment, a regression technique to correct prices of goods for the measurable quality improvements (say, air conditioning in cars, faster processing speeds in laptops). This is somewhat arbitrary in any case. But it can potentially lead to implausibly high calculated growth rates for sectors such as ICTs. This possibility was flagged up early in the debate about hedonic adjustment of prices by Milton Gilbert, one of the architects of the System of National Accounts, who pointed out that in the extreme the method could suggest growing real output of a product whose physical volume was shrinking toward zero: if people happily wore nothing at all on the beach would we argue that the “real” output of bathing suits was the same as in the Victorian era, he asked? As the great Thomas Schelling once pointed out: “[W]hat we call ‘real’ magnitudes are not completely real; only the money magnitudes are real. The ‘real’ ones are hypothetical.”36

Not surprisingly, price indices will be a major focus of the work contributing to the next revision of statistical standards. However, some researchers have suggested more radical approaches moving away from the idea of real GDP as the benchmark for economic welfare. One suggestion, from Charles Hulten and Leonard Nakamura, is to introduce an expanded GDP concept, taking the conventional GDP figures based on efficiency of resource use in production and augmenting them with additional efficiency in consumption, the additional value consumers gain from given output thanks to innovation.37 Another, which goes still further away from the present focus on production and productivity, is to consider how people use their time and the value they gain from different activities, as time use seems a natural metric for a services-based economy.38 Some services will be more “productive” the faster they can be carried out, and these will be the more routine and potentially automatable. Others, more bespoke, will be more valuable to consumers if they take more time, and provide higher quality. In this latter case, the price consumers pay will directly reflect the perceived value. These two varieties could exist in the same conventionally defined sector: consider routine blood tests versus care in the intensive care unit, or a quick shave at the barber versus a designer haircut. It is early days and there will be other suggestions for rethinking the conceptual framework for the economy before economists and statisticians converge on the successor to today’s lens on the economy, including the powerful arguments for thinking far more broadly about what measurement “beyond GDP” is needed for a valid sense of economic welfare or well-being.39
The fact that there are so many measurement issues raises the more fundamental question of whether “productivity” is the best way to conceive of how well the economy is progressing
None of this implies there is no productivity problem. In the ten years-plus since the financial crisis, too few people in the OECD middle classes have seen the steady gains in prosperity that sustain stable societies.40 New innovations are welcome but they must deliver wide benefits for consumers. Addressing the pessimistic sense that the next generation will be worse off than their parents is one of the policy challenges of our times.41 There are plenty of signs that this will be a politically turbulent period, like previous decades of sustained slow growth in the twentieth century. Measurement questions might seem like a distraction at times like this, but when the questions are as extensive and complex as they are now they point to deeper questions: what do we mean by the idea of progress, and what measures do policy makers need to understand what is happening in the economy and society, and to deliver broad-based, sustainable improvements in citizens’ lives.
Its economic characteristics make data valuation particularly difficult because, although there are some market transactions in data allowing prices to be discovered, data is a non-rival, public good with externalities, meaning there is a wedge between market valuation and economic welfare

Acknowledgments
My thanks to Julia Wdowin for her research assistance.
Comments on this publication