Introduction
The economic and financial crisis which started in 2008-09 has thrown the European economy into a ‘‘double-dip’’ recession and overall stagnant growth for a lengthy period of time. The region now faces two significant gaps in its growth performance. The first is a gap relative to its own pre-crisis growth performance. The second is a worsening of a pre-crisis performance gap relative to the US economy, despite the latter’s own challenges to revive since the Great Recession.
Europe now faces a significant gap in its growth performance in contrast with that of pre-crisis years, and a worsening of the gap in relation to the US economy
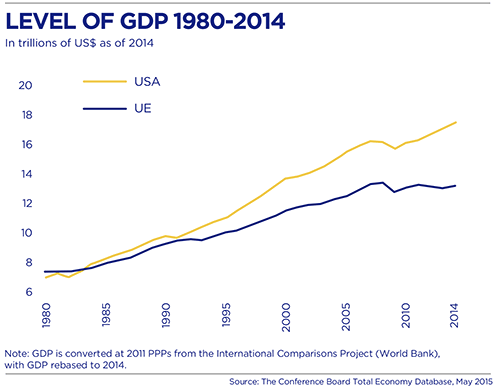
Europe’s growth shortfall from both perspectives is very visible at the aggregate level of GDP. In 1980, the level of GDP of what constitutes the EU-28 today was 45 percent above that of the United States, but it gradually narrowed to about 10 percent just before the 2008-09 crisis (see chart 1). By 2014, GDP in Europe was only 6 percent above the US level. GDP performance for the Euro Area has weakened even more, relative to the US. In 1995, the level of GDP of what is the Euro Area-19 today was about 10 percent lower than the US level, but the gap was as big as 25 percent in 2014.
Chart 1
The weaker output performance in Europe is also reflected in a larger per capita income gap relative to the United States. For example, per capita income in the Euro Area-19 hovered between 75 and 80 percent of the United States level between 1980 and 1995. However, after 1995, it dropped below 75 percent of that same level, then briefly recovered during cyclical upswing around 2005 to 2006, and has yet dropped further since the crisis, especially since 2011, to only 71 percent in year 2014 (see chart 2).
Chart 2
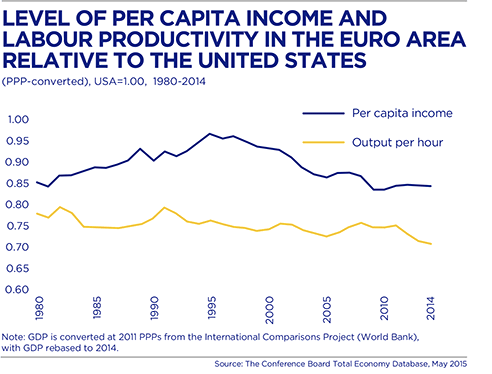
Compared to per capita income, productivity showed a very different pattern relative to the United States. Between 1980 and 1995, per capita income in the Euro Area was supported by a rapid closing of the gap in output per hour from 85 percent of the US level to more than 95 percent. During this period, productivity was driven by increased capital intensity while employment growth was quite slow. Between 1995 and the start of the 2008-09 crisis, employment growth in Europe improved, but weaker productivity performance increased the gap in per capita income relative to the United States.
Since the onset of the crisis, the American and most European economies experienced a drastic decline in both employment and productivity growth, creating a gap relative to their own pre-recession performance. While employment has begun to recover, there have been virtually no signs of a significant recovery in productivity growth beyond some short-lived, pro-cyclical improvements in 2010. Productivity growth, in fact, weakened substantially in both economies, and as a result, the productivity gap in terms of output per hour between Europe and the United States has remained largely unchanged since 2009. Per capita income dropped off further because of much weaker output recovery in Europe.
Weak productivity growth is a major factor slowing the speed of growth recovery in Europe
In this contribution, I argue that weak productivity growth is a major factor slowing the speed of growth recovery in Europe. We also find that the productivity growth slowdown has broadened from the services sector to manufacturing, which has been a traditional stronghold for productivity in Europe. These trends are all the more surprising, as the productivity slowdown seems to happen during a time of a rapid rise of the digital economy. While the lack of demand since the onset of the crisis has held back the potential to improve productivity, the lack of investment in the most important assets for a productivity recovery, namely the intangible (or knowledge) assets in the economy, is a key factor as well. In addition to ICT capital, the intangibles include other information assets, such as data, innovative property and economic competencies, including workforce training, organizational innovations, branding and marketing. In the light of slowing labour supply across European economies in the coming decades, I argue that the key to supporting growth in Europe is to strengthen productivity by complementing physical (tangible) assets in the economy with intangible assets that drive technological change and innovation.
An analysis of the sources of growth
A decomposition of the annual average growth rates in aggregate GDP into the contributions of labour, capital and TFP reveals some stark differences in Europe’s growth performance relative to its own history and compared to the United States (see table 1). Although, from 1999 to 2007, Europe and the Euro Area saw a faster increase in the contribution of working hours to growth than the United States, hours have contributed negatively since the beginning of the crisis in Europe and have provided a zero contribution in the United States.
Table 1
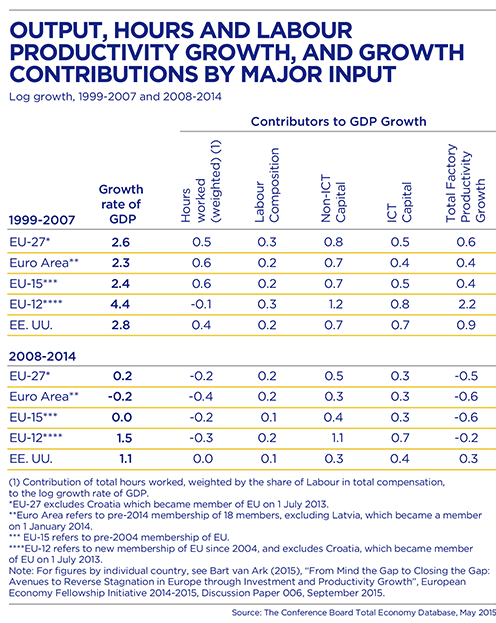
The contribution of past and present investments, measured as capital services from ICT and non-ICT assets, have been the main drivers of GDP growth in the aggregate EU and the US. Before the crisis, non-ICT capital accounted for about 0.8 percentage points of GDP growth in the EU, but it has declined to 0.5 percentage points since the crisis. In the Euro Area, the contribution of non-ICT capital dropped from 0.7 to 0.3 percentage points, which was comparable to the drop-off in the United States.
The US advance in the ICT capital contribution to growth was much higher (at 0.7 percentage points) than in Europe (at 0.5 percentage points) and the Euro Area (at 0.4 percentage points) during the 1995 to 2007 period. In the US, much of the faster investment pace during the ‘‘new economy’’ era of the late 1990s was driven by the scale effects from larger US markets, especially in market services, such as trade and transportation, which could not be easily replicated in Europe (Inklaar et al. 2008). Since 2008, the ICT capital contribution to growth slowed down considerably in both regions, and slightly more in the United States (from 0.7 to 0.4 percentage points) than in the EU-28 (from 0.5 to 0.3) and in the Euro Area (from 0.4 to 0.3).
The biggest concern with regard to Europe’s growth rate relates to the slow rate of total factor productivity (TFP) growth, which measures the efficiency of the combined use of labour and capital. As mentioned above, this trend is all the more surprising given the rapid rise of digital technology in the past decade. The slowing trend in TFP growth can be explained in different ways. Beyond the temporary impact from the recession related to weak cyclical demand, slow total factor productivity growth might signal weakening innovation and technological change. Companies may be holding back investment in those areas due to longer term concerns about a negative spiral of weak demand and investment, in which low nominal interest rates do not help to drive up investment—the so-called secular stagnation hypothesis. 2
However, slow total factor productivity growth may also be caused by difficulties on the supply side to implement new technologies. It is a well-known fact that new technology regimes, such as the current convergence of ubiquitous broadband and mobile, supported by cloud computing and big data analytics and reflected in the rise of apps economy and the sharing economy, take time to translate themselves into more productivity applications. In the extreme, a minority of scholars argue that the potential impacts of this latest digital technology wave fade in comparison to previous major technology booms, such as the electricity grid or the combustion engine. 3 More likely, it could be that the impact of new technologies is delayed, for example, due to a shortage of skilled workers, a lack of organizational innovations or other factors.
But for the total factor productivity growth rate to turn negative, additional explanations are needed. First, it could signal an increase in rigidities in labour, product and capital markets during the crisis, causing increased misallocation of resources, away from higher-productivity to lower-productive firms. This may especially be so in times during which scale-dependent technologies, such as communication technology, require flexibility across a larger economic space. Limited scale effects in Europe, related to fragmented markets and limited impacts from ICT utilization, might have played a larger role than in the United States.
Second, we can also not exclude the possibility that measurement issues hide the productivity impacts related to the introduction of new technologies and subsequent innovations. The potential productivity gains from the rise of the digital economy pose huge measurement challenges. Inadequate price measures, a failure to measure consumer surplus and, importantly, the inadequate reflection of the productivity gains from the apps economy in the output statistics may cause a potential downward bias in the output measures. However, the lack of proper investment measures reflecting the so-called intangible assets, such as human capital, information assets, innovative property and economic competencies, add to the complexity of measurement issues. In any case, from the perspective of understanding the growth gap across the Atlantic, it is unlikely that the measurement bias in technology is any bigger in Europe than it is in the United States. 4
An industry perspective on the
productivity slowdown in Europe
When looking at Europe’s productivity performance from an industry perspective, a striking difference can be observed. Before the crisis, Europe was a productivity strong hold in the manufacturing sector (excluding ICT production), but a much weaker performer in ICT products and services and more generally the author’s in the market services sector. 5 Since the crisis, however, Europe has also lost its productivity advantage in non-ICT manufacturing. Table 2 presents the average yearly growth rates of labour productivity for the combination of eight major Euro Area economies, the United Kingdom and the United States, for 1999-2007 and 2008-2013.
Table 2
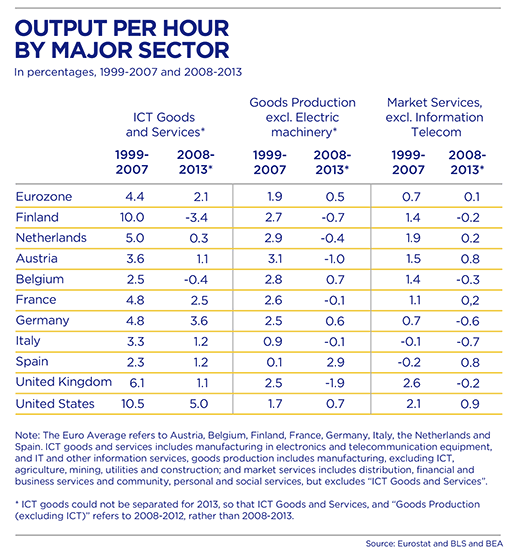
The productivity measures are divided between three main sectors. 6 Firms in the ICT goods and services sector often experience very strong productivity gains. Even though ICT-producing firms only represent a small part of the economy (about 8 percent of total GDP in Europe), they accounted for a much larger share of productivity growth in the market sector. 7 Before the onset of the crisis, US labour productivity in the ICT sector grew at 10.5 percent vis-à-vis 4.4 percent per year in Europe. Only Finland posted productivity growth rates in the same range as the US, whereas in other Euro Area countries, productivity growth rates in ICT production were mostly less than half of that. Even though European countries continued to grow employment in the ICT sector after the emergence of the crisis, productivity growth stayed well behind the US, although the latter’s economy also saw productivity growth in the ICT sector halved—even though a downward measurement bias could play a role here.
In the goods producing sector, which mainly comprises manufacturing (excluding ICT), but also agriculture, mining, utilities and construction, productivity growth was higher than in the US in seven of the nine European economies (except for Italy and Spain) before the crisis. The average growth rate of labour productivity in the Euro Area goods production sector was 1.9 percent from 1999 to 2007 versus 1.7 percent in the United States.
Clearly, the differences in goods productivity performance reflect the specialization of goods production. For example, the US and Nordic economies strongly concentrated in high-tech ICT sectors (which are separate from the estimates for the goods producing sector). In contrast, European continental economies saw a broader range of specializations across manufacturing sectors, such as Germany’s stronghold in investment goods and high-end specialized manufactured products, France’s specialization in infrastructure and transportation equipment, and Belgium and the Netherlands’ concentration on chemical and related industries.
In the early aftermath of the recession, labour productivity growth for European goods producing sectors dropped off significantly to 0.5 percent from 2008 to 2012, to a large extent because of the cyclical impact which typically hits tradeable goods harder than less-tradeable services, and fell slightly below the US growth rate (at 0.7 percent) for the same period. With the exception of Spain, none of the European economies saw faster productivity growth than the US in goods production (even excluding ICT) after 2008. The more moderate decline in US productivity growth was largely achieved by a rapid layoff of manufacturing and construction workers. In most European countries, employment growth rates did not decline as much, with the notable exception of Spain and Italy where they fell dramatically. In several countries, in particular Germany, temporary employment subsidy programs supported labour hoarding in manufacturing. More recent estimates of manufacturing output show that the cyclical recovery effects on manufacturing have largely played out. Still, by 2014, manufacturing value added levels in Europe were still below the pre 2008 level, raising the question of whether Europe will successfully reestablish its earlier dominant position as a top performing region in world manufacturing.
The differences in goods productivity performance reflect the specialization of goods production
The market services sector, which includes distribution, financial, business and personal services, but excludes ICT services, showed the opposite in relative productivity performance compared to goods production. On average, labour productivity growth in market services was 0.7 percent for the eight Euro Area economies from 1999 to 2007, well below the 1.9 percent in the goods producing sector. In the US, we saw the opposite, with market services productivity at 2.1 percent from 1999 to 2007, ahead of the 1.7 percent labour productivity growth rate in goods production (excluding ICT) (see table 2).
The weak productivity performance in market services (excluding ICT) has been extensively documented in our earlier work (see footnote 5), but it has significantly worsened since the crisis—although it weakened in the US as well, dropping to a negative -0.1 percent from 2008 to 2013. In earlier work, we stressed particularly large productivity shortfalls relative to the US in trade and transportation sectors in Europe. 8 Smaller productivity effects from investment in ICT in those sectors seemed to have played a large role. Factors related to market structure, competition and lack of a European single market for services added to the perils of Europe’s productivity performance in market services.
Overall, the sectoral growth accounts for why European countries show considerable declines in labour productivity and TFP growth across the board over the past two decades, even though productivity in goods production (excluding ICT) has remained relatively strong compared to market services. However, the distinction between goods and services, and more specifically between manufacturing and business services, is increasingly artificial. The two types of activities are increasingly integrated, especially in advanced economies, such as Europe and the United States, where the services’ share in production of manufactured goods has been rapidly increasing. For example, both Europe and the United States increased its real income obtained from manufacturing production, not only through more competitive manufacturing activity in Europe, but especially through an increase in the contribution of service sector activities to the global value chain of manufactured products. 9
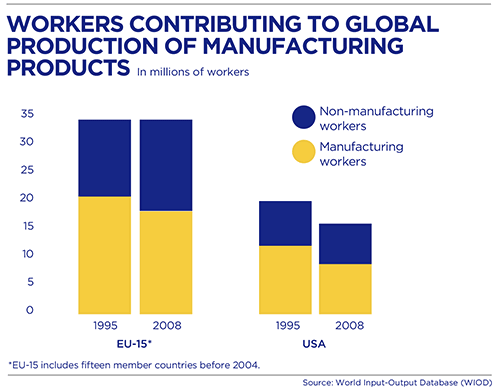
While the number of workers in the manufacturing sector in the old EU-15 member states producing for global manufacturing declined from 21.2 million workers in 1995 to about 18.5 million in 2008, the number of workers in non-manufacturing industries involved with foreign production rose from 13.5 million workers in 1995 to 16.5 million in 2008. Over the same period, the United States lost workers for foreign manufacturing production in both sectors between 1995 and 2008. Hence, for Europe to compete in the global economy, one needs to widen the perspective from manufacturing productivity to services sector productivity as well (see chart 3).
Chart 3
The role of intangible investments in the diffusion of new technologies
Technological progress and innovation have an impact on productivity directly, through growth of the ICT sector, for example, and indirectly, through the adoption of those technologies across the economy. In particular, the latter effect, which may be referred to as the diffusion effect, should not be considered in isolation from a broad concept of investment beyond machinery and equipment. In recent years, important literature has emerged, highlighting that organisational changes and other forms of intangible investment are necessary to gain significant productivity benefits from using ICT. 10
Incorporating non-technological innovations (design and financial innovations), workforce training, improvements in organizational structures, marketing and branding, and—importantly—the creation of databases and other digital systems as part of an economy’s creation of capital shows that digitalization does not happen on its own. As indicated above, traditionally, the expenses on such intangibles have not been capitalized in the national accounts (nor on company balance sheets, for that matter), but important conceptual and empirical work has transformed our view of how investment impacts productivity. 11 This work divides intangibles into three broad categories: computerized information (software and databases), innovative property (scientific R&D, design and financial innovations) and economic competencies (workforce training, improvements in organizational structures and marketing and branding).
It turns out that Europe (here the EU-15 aggregate) has a much lower investment intensity in intangibles than the United States (see table 3). The share of all measured intangible investment in value added for the market sector in the EU-15 has increased by 1 percentage point, from 9.5 percent of market sector value added in the 1995 to 2002 period to 10.5 percent from 2008 to 2010, by which time it was about two-thirds of the US intangibles share in market GDP, which was 15.3 percent. 12 While Europe’s intangibles intensity was below that of the US in all categories, it was particularly weak in R&D and other innovative property and in market research and advertising. Weaker R&D is, in part, related to the less intensive, high-tech nature of Europe’s manufacturing sector compared to the United States, whereas lower market research and advertising intensity is due to a smaller share of distributional and personal services in the European economies relative to the United States. Within the EU-15, the Scandinavian countries, France and the UK have the highest intangibles intensity, but even here, the gap with the US remains significant. Many other EU-15 economies, include Italy, Greece and Portugal, currently invest less than half in intangibles as a percentage of GDP compared to the US.
Table 3
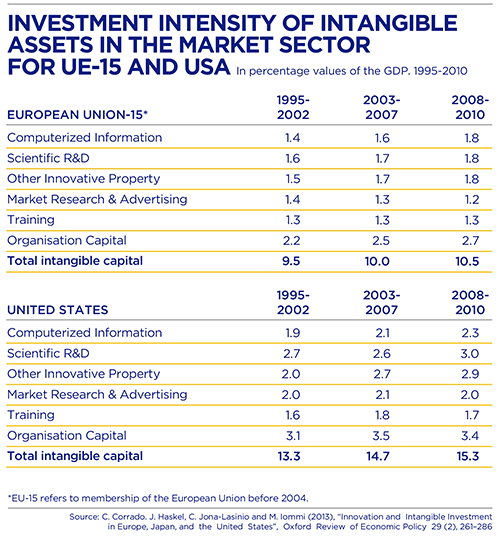
The EU showed weaker growth than the US over the entire period in all three asset types and also saw lower increases especially in computerized information and economic competencies (especially organizational capital) during the late 1990s. The intensity of intangibles is, in part, related to the structure of the economy, which explains the relatively high intangible shares for the United Kingdom and the United States, which both have large shares of GDP in service sectors. These economies have relatively large shares of their intangibles concentrated in economic competencies, notably organizational investments, and in ICT. In Germany, which has a share of GDP in manufacturing, the role of innovative property, including R&D, is relatively more important.
ICT and intangible assets are connected in many ways. Some ICT assets, such as software and databases, are themselves classified as an intangible asset. ICT can also facilitate the deployment of other intangible assets and enable innovations across the economy, such as the re-organisation of production. It can also involve the streamlining of existing business processes, for example, order tracking, inventory control, accounting services and the tracking of product delivery. At the same time, capital deepening in intangible assets also provides the foundation for ICT to impact productivity. For example, the internal organisation of a firm plays a role in its ability to use ICT more efficiently, in particular through managerial and other organisational changes. 13
Going beyond complementarities between ICT and intangibles, there is also increasing evidence of a strong relationship between intangible capital deepening and total factor productivity growth. While consistent with the existing evidence on spillover effects from R&D, the extension to other assets suggests that many intangible capital assets have such public-good characteristics. 14 Clearly, one also requires caution by not overstating the realization of the spillover potential from intangibles. For example, spillovers might not occur if intangible capital is protected by intellectual property rules (copyright, trademarks, etc.) or tacit knowledge (internal knowledge of supply chain management, for example).
Towards closing Europe’s growth gap
While Europe’s economic policy agenda in the past six years has been dominated by urgent pressures to stabilize financial markets, improve macroeconomic conditions and lower unemployment rates, there is also a need to focus on closing Europe’s growth gap relative to its own pre-recession performance and US performance. Policy attention needs to shift to a more medium-term focus on reigniting growth.
Despite huge political challenges, there is no shortage of possible policy solutions to accelerate Europe’s growth trend. The implementation of structural policy measures, ranging from more investment in hard and soft infrastructure to smarter regulation, more innovation and greater room for entrepreneurship, will hugely matter to improve structural conditions. The five headline targets set out in the Europe 2020 Agenda—create more jobs, accelerate innovation, improve energy efficiency, strengthen education and reduce poverty exclusion—are fundamental components of any successful strategy to deliver positive social change and accelerate growth.
At face value, it makes much sense to direct our attention to investment as a key policy tool to revive growth, as is currently intended under the European Commission’s Investment Plan. However, most of Europe’s investment gap is related to private sector investment, requiring structural reforms that make markets function better across Europe. 15 In this contribution, we have put greater emphasis on the need to strengthen investment in the area of intangible assets to drive innovation and organizational change. Such investments can create positive externalities to productivity. However, the productivity of investment and the way it translates into total factor productivity growth depends strongly on the ability to strengthen static effects (focused primarily on cost reductions and allocative efficiency) and dynamic effects (related to competition in product, labour and capital markets and innovation) from a large single market in the European Union. Recent analysis shows that the creation of Single Digital Market and a single market for services across the European Union could contribute significantly to unleash the productivity gains from larger market size. 16
The sluggish recovery in productivity suggests that medium-term factors are still predominant in explaining the productivity slowdown. The persistent shortfall in demand and an erosion of supply side factors, as established by the long-term slowdown of potential output, can be an important explanation for Europe’s growth gap. However, it is also possible that there is a lull in the emergence of productive technology applications or that the negative productivity impact of the regulatory environment is playing a larger role than before the crisis. These factors significantly impact the timing and speed of the productivity recovery in Europe.
Notes:
1 The Conference Board and University of Groningen. This contribution is in part based on a research paper for the European Commission, DG ECFIN, titled “From Mind the Gap to Closing the Gap: Avenues to Reverse Stagnation in Europe through Investment and Productivity Growth,” European Economy Fellowship Initiative 2014-2015, Discussion Paper 006, September 2015; and on a recent paper co-authored with Mary O’Mahony, titled “Productivity Growth in Europe Before and Since the 2008/09 Economic and Financial Crisis,” in The World Economy: Growth or Stagnation? Edited by D.W. Jorgenson, K. Fukao and M.P. Timmer. Cambridge University Press, 2016.
2 See, for example, C. Teulings, and R. Baldwin (2014), “Secular Stagnation: Facts, Causes and Cures,” VoxEU, Centre for Economic Policy Research, London.
3 See, for example, Robert J. Gordon, “US Productivity Growth: The Slowdown Has Returned after a Temporary Revival,” International Productivity Monitor 25, Spring 2013; Tyler Cowen, The Great Stagnation: How America Ate All the Low-Hanging Fruit of Modern History, Got Sick, and Will (Eventually) Feel Better, (New York: Dutton Adult), 2011.
4 For a recent commentary, see the author’s blog post, titled “Blaming the productivity slowdown on measurement issues takes our eyes off the ball”.
5 See B. van Ark, M. O’Mahony and M.P. Timmer, “The Productivity Gap between Europe and the U.S.: Trends and Causes”, Journal of Economic Perspectives, Vol. 22 (1), Winter 2008, pp. 25-44. And M.P. Timmer, R. Inklaar, M. O’Mahony and Bart van Ark, Economic Growth in Europe. A Comparative Industry Perspective, Cambridge University Press, 2010.
6 The analysis does not include non-market services, which comprise education, health care, public administration and real estate services. Measurement problems with regard to output in non-market services are large, and, therefore, we refrain from showing those separately. Real estate activities are also included with non-market services, as the output measure includes imputed rents on owner-occupied dwellings, making the interpretation of the productivity measure problematic.
7 See Corrado, C. and K. Jäger (2014), Communication Networks, ICT and Productivity Growth in Europe, Economics Program Working Paper #14-04, The Conference Board, New York.
8 See footnote 5 for references.
9 See, for example, M.P. Timmer, A.A. Erumban, B. Los, R. Stehrer, and G. J. de Vries, Slicing Up Global Value Chains,” Journal of Economic Perspectives, 28(2): 99-118, 2014.
10 See, for example, M.P. Timmer, A.A. Erumban, B. Los, R. Stehrer, and G. J. de Vries, “Slicing Up Global Value Chains”, Journal of Economic Perspectives, 28(2): 99-118, 2014.
11 See, for example, C. Corrado, C. Hulten, and D. Sichel, D., “Measuring Capital and Technology: An Expanded Framework,” in C. Corrado, J. Haltiwanger and D. Sichel, eds, Measuring Capital in the New Economy, University of Chicago Press, pp. 11–46; C. Corrado, J. Haskel, C. Jona-Lasinio and M. Iommi (2013), “Innovation and Intangible Investment in Europe, Japan, and the United States,” Oxford Review of Economic Policy 29 (2), 261–286.
12 The estimates refer to the ‘‘market’’ economy, excluding education, health and public administration.
13 I. Bertschek and U. Kaiser (2004), “Productivity effects of organisational change: Microeconometric evidence”, Management Science, 50(3): pp 394-404. T.F. Bresnahan, E.Brynjolfsson, L.M. Hitt (2002), “Information Technology, Workplace Organization, and the Demand for Skilled Labor: Firm-Level Evidence,” Quarterly Journal of Economics, 117 (1): pp 339 – 376.
14 More extensive regression analysis in Corrado et al. (2013) suggests this to be the case.
15 DIW, Economic Impulses in Europe, DIW Economic Bulletin, No. 7, Berlin, 2014
16 B. van Ark, Productivity and Digitalisation in Europe: Paving the Road to Faster Growth, The Lisbon Council and The Conference Board, Brussels/New York, 2014; M. Mariniello, A. Sapir, A. Terzi, “The long road towards the European Single Market,” Bruegel working paper 2015/01.
Comments on this publication