Considering the recent increase of socioeconomic segregation in cities worldwide, scholars of urban technology Carlo Ratti and Yang Xu put forward a new metric with which to study and counter such a phenomenon. While past research has focused on residential segregation, this article argues that segregation needs to be tracked more dynamically: across the urban environment and not just at home; through time and not just space; and by monitoring its presence in social space and not just physical space. These methods require more dynamic data as well: Ratti and Xu argue for the greater cost-effectiveness and possibilities presented by mobile-phone data. They conclude by speculating on some design actions cities could take to encourage greater mixing between different groups.
The past half century has witnessed an accelerated process of global urbanization, bringing profound changes to the spatial distribution of the world’s population and the underlying human activities. In 2007, the world’s urban population surpassed, for the first time in history, the global rural population (United Nations, 2014). It is projected that, by 2050, more than two thirds of the world population will live in urban areas, a good fraction of them in so-called “megacities.” Such agglomerations will bring numerous social and economic benefits to urban dwellers. However, rapid urbanization might also cause or exacerbate certain issues. Social segregation, a long-standing challenge for cities, remains to be a headache for urban governors and policy makers.
Urban segregation, by its classic definition, refers to the physical separation or uneven distribution of social groups in cities. Social groups, in this context, are usually measured using their social, economic, and/or demographic characteristics. The variations in how social groups are distinguished result in different perspectives of urban segregation, covering the racial, ethnic, income, and other aspects of social mixings in cities.
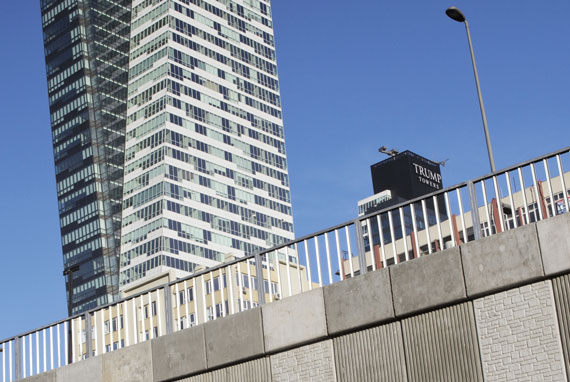
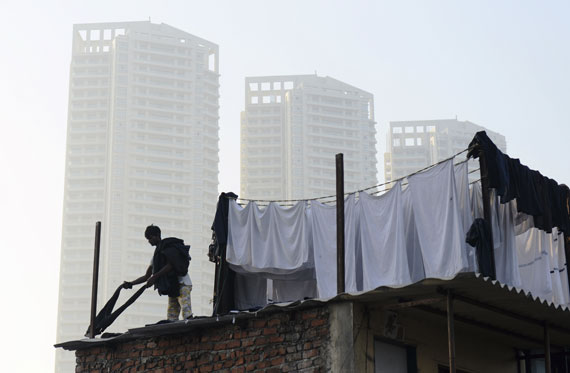
Why tackling segregation is becoming so pressing? One crucial reason is that segregation is usually tied to inequality, which marks the unequal access of different social groups to certain resources or benefits. The physical sorting of social groups in cities, which is just an appearance of urban segregation, could lead to many fundamental issues that are detrimental to the well-being of societies. Racial segregation in the United States, for example, has limited access to jobs, education, and public services for people who live in high-poverty neighborhoods (Williams and Collins, 2001). These are not problems just for the Americans. Over the past decade, there has been an increase in socioeconomic segregations in many European cities (Musterd et al., 2017), causing issues of rising poverty, crime, and even terrorism. In Asia, many megacities and urban agglomerations are expected to form in the next twenty to thirty years. Part of the low-income neighborhoods or areas that used to be on the outskirts of the cities will become “urban villages,” separating the disadvantaged groups from the others. What could make the matter worse is that gentrification processes might drive these people out of their habitats. Rising housing prices might force them to move further away from the city centers, resulting in longer commuting distances and decreased accessibility to health facilities and other urban amenities.
In 2007, the world’s urban population surpassed, for the first time in history, the global rural population. It is projected that, by 2050, more than two thirds of the world population will live in urban areas, a good fraction of them in so-called “megacities”
Being aware of the problem does not guarantee a solution. To tackle urban segregation, the initial and important step is to understand to what extent different social groups are separated in cities. In the past few decades, considerable efforts have been devoted in cities to investigate residential segregation (Massey and Denton, 1988). There are two main reasons to focus on this. First, residential location and its surroundings—as one’s primary activity territory—have a profound influence on people’s daily social interactions. A high level of residential segregation signifies social stratification and serves as a driving force of many societal issues. The second reason is related to the limitation of traditional data-collection techniques. Population census in many countries is conducted every five or ten years. Such data capture static snapshots of population footprint and demographic information. They are suitable for measuring residential segregation but are unable to deliver a timely view of socioeconomic configurations in cities.
Would it be useful to measure urban segregations beyond residence? The answer is obvious. Social segregations do not only take place where people live, but also where people work, study, and entertain themselves (Hellerstein and Neumark, 2008). Different types of places could play different roles in dampening or strengthening a city’s social integration. An improved understanding of social dynamics requires observing human interactions at workplaces, schools, shopping malls, and all kinds of public spaces. However, a comprehensive view of urban segregation cannot be achieved by only focusing on the spatial dimension. How do the social mixings of a city change over time? Residential segregation already gives us a nighttime story, but what about the counterpart during daytime? Such a temporal perspective is desired simply because cities are rather dynamic. As people get up in the morning and start to move, the changes in urban mobility would reshape the socioeconomic configurations of a city. The impacts of human mobility on segregation as well as its policy implications remain to be better understood.
Social segregations do not only exist in physical space. In the past two decades, Internet and telecommunication technologies have permeated almost every aspect of human life, moving the world toward a place with ubiquitous connectivity. The technological advancements have created a digital world in which new forms of social communications are emerging. How will these changes affect the social structures of cities? Is there a stratification in the social world, and whether it is simply an image of how people interact in physical space? Answering these questions could deliver a more holistic view of social mixings in cities. Unfortunately, the data we used to rely on, such as census and travel surveys, are unable to capture human social interactions in the “social space.” There is a need to redefine how we address urban segregations in today’s world, and it is not only about new data, but also new metrics, and new strategies for tackling this enduring urban issue.
In this article, we first review some of the leading research in this field. We then provide some thoughts on how to develop a new metrics for quantifying urban segregation. Finally, we discuss how the metric can possibly inspire new design principles for better integrating socioeconomic classes in cities.
Measuring Residential Segregation: Some Existing Efforts
Understanding the spatial separation or concentration of different population groups in physical space has long been a research interest in sociology, economics, geography, urban planning, and other fields. For decades, studies have primarily focused on investigating segregation at places of residence (Massey and Denton, 1987; Reardon and O’Sullivan, 2004), and a series of methods have been developed to quantify the uneven distribution of social groups in physical space. The index of dissimilarity (DI) is one of the most commonly used methods in segregation studies (Duncan and Duncan, 1955). The index, which was often used in two-group cases (for example, segregation between black and white), is interpreted as the proportion of minority members that would have to change their area of residency to achieve a perfect social integration (that is, an even distribution in all areas), normalized by the proportion of minority members that would have to move under conditions of maximum segregation (that is, no areas are shared by the two groups). Since it was developed, the dissimilarity index was employed in many studies due to its simplicity in representing segregation. Despite the heavy use of DI, the definitions of residential segregation vary among researchers and many other indices have been developed to quantify segregation from different perspectives. This has triggered extensive discussions on the redundancy of segregation indices as well as which ones should be mainly adopted (Cortese et al., 1976; Taeuber and Taeuber, 1976). By examining twenty segregation indices using factor analysis, Massey and Denton (1988) concluded that these indices mainly explain five distinct dimensions of residential segregation, which are evenness, exposure, concentration, centralization, and clustering. Evenness measures the imbalance of two or more population groups in different neighborhoods, while exposure quantifies the interaction potential among social groups. These two dimensions have attracted more attention in empirical studies than the other three.
The index of dissimilarity (DI), one of the most commonly used methods in segregation studies, is interpreted as the proportion of minority members that would have to change their area of residency to acheive a perfect social integration
Since Massey and Denton’s reflections on the five principal dimensions, continuous efforts have been devoted to examining residential segregation, but mainly from the perspective of race or ethnicity (Johnston et al., 2005; Musterd and Van Kempen, 2009). In these studies, social groups were modeled as binary or categorical variables (for example, white/black people). Thus, many commonly used segregation indices, such as index of dissimilarity (Duncan and Duncan, 1955), isolation index (White, 1986), and Theil’s entropy index (Theil, 1972), can be directly applied to measure segregation patterns within a population or region. These indices, although frequently used, are not without limitations. First, many existing indices (for example, index of dissimilarity and isolation index) only provide the overall segregation within a given region or population, thus failing to distinguish the differences among individuals or places. Another critique is that traditional methods usually focus on measuring groups that can easily be defined as nominal categorical variables (Reardon, 2009). This makes them inapplicable when social groups need to be modeled as ordered categories or as a continuous variable. For instance, most of the existing methods cannot deal with income segregation, which is an important dimension of segregation in many contemporary cities.
Beyond Residential Segregation: Toward a Dynamic View
Through the years, researchers have gained numerous insights into segregation at places of residence. With the help of longitudinal census data, residential segregations in many cities and their evolutions have been well documented. It is found that residential income segregation—in twenty-seven of the thirty largest metropolitan areas in the United States—has increased during the past three decades (Fry and Taylor, 2012). Besides separating the rich from the poor, these cities are also producing an increased isolation between racial groups (Fry and Taylor, 2012). Similarly, there has been an increase in socioeconomic segregations in European capital cities between 2001 and 2011 (Musterd et al., 2017). Such an increase, as concluded by the authors, is linked with structural factors such as social inequalities, globalization and economic reconstructing, welfare regimes, and housing systems.

Much has been investigated about residential segregation. But what about other places? How are people brought together in cities when they engage in different types of activities? Some of the efforts dedicated to these questions include the work from Ellis et al. (2004), Hellerstein and Neumark (2008), and Åslund and Skans (2010), in which they investigated racial or ethnic segregation at workplaces. Two key messages are delivered in these studies. First, besides a spatial separation of social groups at people’s residence, some US and European cities also exhibit substantial workplace segregation (Hellerstein and Neumark, 2008; Åslund and Skans, 2010), indicating other factors that would influence the social mixings in cities (for example, labor market, immigration policy, and education). On the other hand, it is shown that workplaces could reduce segregation by bridging people with different social backgrounds (Ellis et al., 2004). This suggests the importance of pursing a dynamic view of social segregation in cities.
In twenty-seven of the thirty largest metropolitan areas in the United States residential income segregation has increased during the past three decades. Besides separating the rich from the poor, these cities are also producing an increased isolation between racial groups
As we acknowledge the contributions from these researchers, one thing worth mentioning is that their results are still delivered through snapshots at certain locations (for example, workplaces). The diurnal patterns of social segregation in cities remain largely untapped. Since census data only depict a static view of population distribution, they are not suitable for measuring segregation beyond where people live and work. Travel surveys can capture movements and demographic information of the same population. Such data could enrich the temporal aspects of segregation in cities. In one recent study, Le Roux et al. (2017) used a travel survey data to quantify segregation hour by hour from respondents’ educational and socio-professional indicators. The authors found that “segregation within the Paris region decreases during the day and that the most segregated group (the upper-class group) during the night remains the most segregated during the day” (p. 134, Le Roux et al., 2017). Such a new perspective of “segregation around the clock” reveals the dynamic impacts of urban spaces on social mixings, which could also inspire new practices in urban design.
Urban Segregation in the ICT and Big Data Era: Toward A Hybrid View
On April 3, 1973, Martin Cooper at Motorola used a handheld device to make the first ever mobile telephone call in history. Since then, information and communication technologies (ICTs) have developed rapidly, unifying telephone and computer networks into an interconnected system. As a collective benefit for modern society, the social channels for human interactions have been greatly enriched. Face-to-face communication is no longer the only way to maintain interpersonal relationships in the contemporary world. Mobile phones, e-mails, and various social networking sites have become the new darlings for human social interactions. Such technological advancements have profound yet unclear implications on societies’ social structures. On the one hand, some people believe that human social interactions are no longer bounded by where they live, work, and entertain. In other words, geographic distance or proximity are expected not to influence how people connect with others. On the other hand, evidence has shown that the structures of online social networks are potentially shaped by the physical world. One good example is the “distance decay” effect discovered in many online social networks, in which the probability of friendship is inversely proportional to the geographic distance (Krings et al., 2009; Xu et al., 2017). That means that human interactions in physical and social space are related to each other. Unifying the two spaces, therefore, would result in a more comprehensive picture of social mixings in cities.
The past couple of years have witnessed some new efforts in studying urban segregations. For example, Silm and Ahas (2014) conducted a temporal analysis of ethnic segregation in Tallinn, Estonia, based on human movements extracted from mobile-phone data. The study demonstrates a cost-effective approach that can capture the diurnal patterns and long-term evolution of urban segregation. Mobile-phone data, which are usually collected by cellular companies for billing purposes, were put under the spot light in this study. Due to the abilities to capture movements of large populations, such data have provided new opportunities for urban dynamics research. Besides human mobility, mobile-phone data can also reveal social network structures. In a more recent study, Leo et al. (2016) examined the socioeconomic imbalances in human interactions using a coupled dataset that records mobile-phone communications and bank transactions of users in a Latin American country. The authors concluded that people tend to be better connected to others of their own socioeconomic classes. These studies demonstrate the potentials of big data in revealing urban segregation—in both physical and social space.

In the past couple of years, Internet and mobile technologies have proliferated around the globe. By 2016, the LTE networks have reached almost four billion people on the earth, covering 53% of the global population (Sanou, 2016). In many developed and developing countries, the mobile penetration rates have reached over one hundred percent. Such numbers are expected to be even higher in urban areas. We are moving toward an age where most of the people use mobile phones to connect to the outside world. The big data produced by ICTs and location-aware technologies have become an enabler for real-time and ubiquitous urban sensing. Mobile-phone data, for example, can be used to analyze city-scale population dynamics. If coupled with sociodemographic information, such data can provide a timely view of social mixings in cities. What is more important is that mobile-phone data can explicitly capture human communications at the individual level. Such information can provide direct evidence on the degree of “homophily” in social networks, which is a salient dimension of segregation in cities.
Note that cities are paying attention to the social merit of these data. Recently, the Türk Telekom initiated a big data challenge named D4R (http://d4r.turktelekom.com.tr). In this initiative, selected research groups will be granted access to an anonymized mobile-phone dataset, so that innovative solutions can be proposed to improve the living conditions of Syrian refugees in Turkey. The dataset, which captures the sightings of refugees and non-refugees when they use mobile phones, allows researchers to analyze their movement and interaction patterns. Such data makes it possible to examine how well the refugees integrate with the others in the country, which would ultimately affect their education, employment, safety, and health conditions. As we celebrate the emergence of these voluminous datasets, one question worth asking is how we can come up with novel metrics—by leveraging rich urban datasets—to reveal the presence or absence of segregation in cities, and how such insights can inform new urban practices?
Prospect on a New Metrics for Urban Segregation
By reviewing existing segregation studies, we feel that it is time to think about a new metrics that can deliver a dynamic and multidimensional view of segregation in cities. But what features should this metric have? What things need to be measured? We start the reflection by referring to some of the research gaps in this field. First, previous studies have put a considerable focus on measuring residential segregation. Census data, which are often used in these studies, provide a static view of population footprint. They are expensive to collect and their update cycles are very long (for example, five or ten years). This makes it difficult to capture a timely view of social mixings in cities. Although travel surveys have mitigated this issue by providing fine-grained human activity information, collecting such data is still costly and time-consuming. We are in need of cost-effective ways to enrich the spatial and temporal aspects of segregation in cities. Second, current measures are mainly designed for measuring spatial segregation. As part of the human interactions become “virtual,” we need new ways to quantify segregation in social space as well as its relationship with the physical counterpart. Third, an improved understanding is needed on how well individual citizens are integrated within cities. Although individual movements and communication activities can now be captured through various sensing technologies, such data have not been used to quantify segregation at the individual level. Thus, we think a good metric for urban segregation should be able to fulfill all or at least some of the following objectives:
— to quantify urban segregation in both physical and social space;
— to depict temporal variation of segregation in cities;
— to distinguish segregation patterns at different urban locations;
— to measure different types of segregations (for example, racial segregation, ethnic segregation, and income segregation);
— to deliver individual-level segregation measures;
— to support intra- and inter-city comparisons.
If equipped with such capabilities, the metrics can then be used to answer profound questions about urban segregation, such as:
— which places in a city, and at what time, are mainly occupied by similar socioeconomic classes? Which places are used by a great diversity of social groups?
— what types of places contribute most to the social integration of a city?
— to what extent is an individual exposed to similar others in physical space or social space? Is there a correlation between the two? (that is, are people who are more isolated in physical space also more segregated in social space?);
— which cities are experiencing more severe social segregations than others?
— how are urban segregations related to the characteristics of cities (for example, economic development, demographic composition, migration patterns, and urban form)?
Figure 1 presents our perspective on a new metrics for urban segregation. As the underpinning of the metrics, multi-source urban data provide new opportunities for coupling movements, social interactions, and demographic characteristics of large populations. Different data types—with their own pros and cons—can be combined in an organic way to facilitate urban segregation studies. Mobile-phone and social-media data, for example, can capture human movements and social interactions simultaneously. Such data could support mobility and social network analysis at population scales. However, due to privacy concerns, these data usually fall short of collecting individual sociodemographic characteristics. Such information, which is important to segregation studies, can be inferred through other innovative approaches. It is found that behavioral indicators extracted from mobile-phone usage can accurately predict an individual’s socioeconomic status (Blumenstock et al., 2015). Other urban datasets, such as census and residential property price, also contain valuable information about urban residents. As a person’s frequented activity locations (for example, home) can be identified from human activity data (for example, mobile-phone data), such information can be further associated with one’s home census tract or local housing price to establish his/her socioeconomic profile. Utilizing such prediction and data fusion techniques allows us to gather valuable input for segregation analysis.
It is found that behavioral indicators extracted from mobile-phone usage can accurately predict an individual’s socioeconomic status. Other urban datasets, such as census and residential property price, also contain valuable information about urban residents
Once such information is available, the next step is to build segregation indicators. But how to formulate measures in a quantitative and reasonable way? Human movement patterns extracted from the previous step (light-blue tier in fig. 1) can be used to quantify the co-presence of individuals in physical space. The measure quantifies how likely two given individuals tend to appear at the same location at approximately the same time. Combining this information with a social similarity metric could effectively describe how individuals are segregated in physical space. For example, an individual who spends most of his time at locations that are mainly occupied by similar others is considered as physically segregated. A similar measure can be designed to quantify segregation in the social space. People who are segregated in social space are those who are dominated by connections (for example, frequent phone communications) within their own socioeconomic classes.
Other than these two individual-level measures (green tier in fig. 1), we can also establish place-based measures. For example, a place which is always used by people with similar social characteristics is quite different from one that is used by a variety of social groups. Such a measure can be realized by first establishing a vector at a given location—with each element representing the proportion of observed people belonging to a certain social class—followed by the calculation of the entropy of this vector. The measures can also be designed as time dependent so that the dynamic characteristics of urban spaces can be quantified.
Upon measures that distinguish individual citizens or places, we also need numeric indices to describe the overall segregation of cities so that they can be compared. On the one hand, existing indices—such as index of dissimilarity and Theil’s entropy index—can be applied directly to quantify segregation in physical space. On the other hand, very few efforts, if any, have been devoted to quantifying the overall segregation in social space (for example, in a mobile social network). There is a need to design new indices to facilitate this purpose. One possible approach would be to measure the deviation from the observed segregation patterns from a “null model,” which assumes that interactions between people are established randomly in social space.
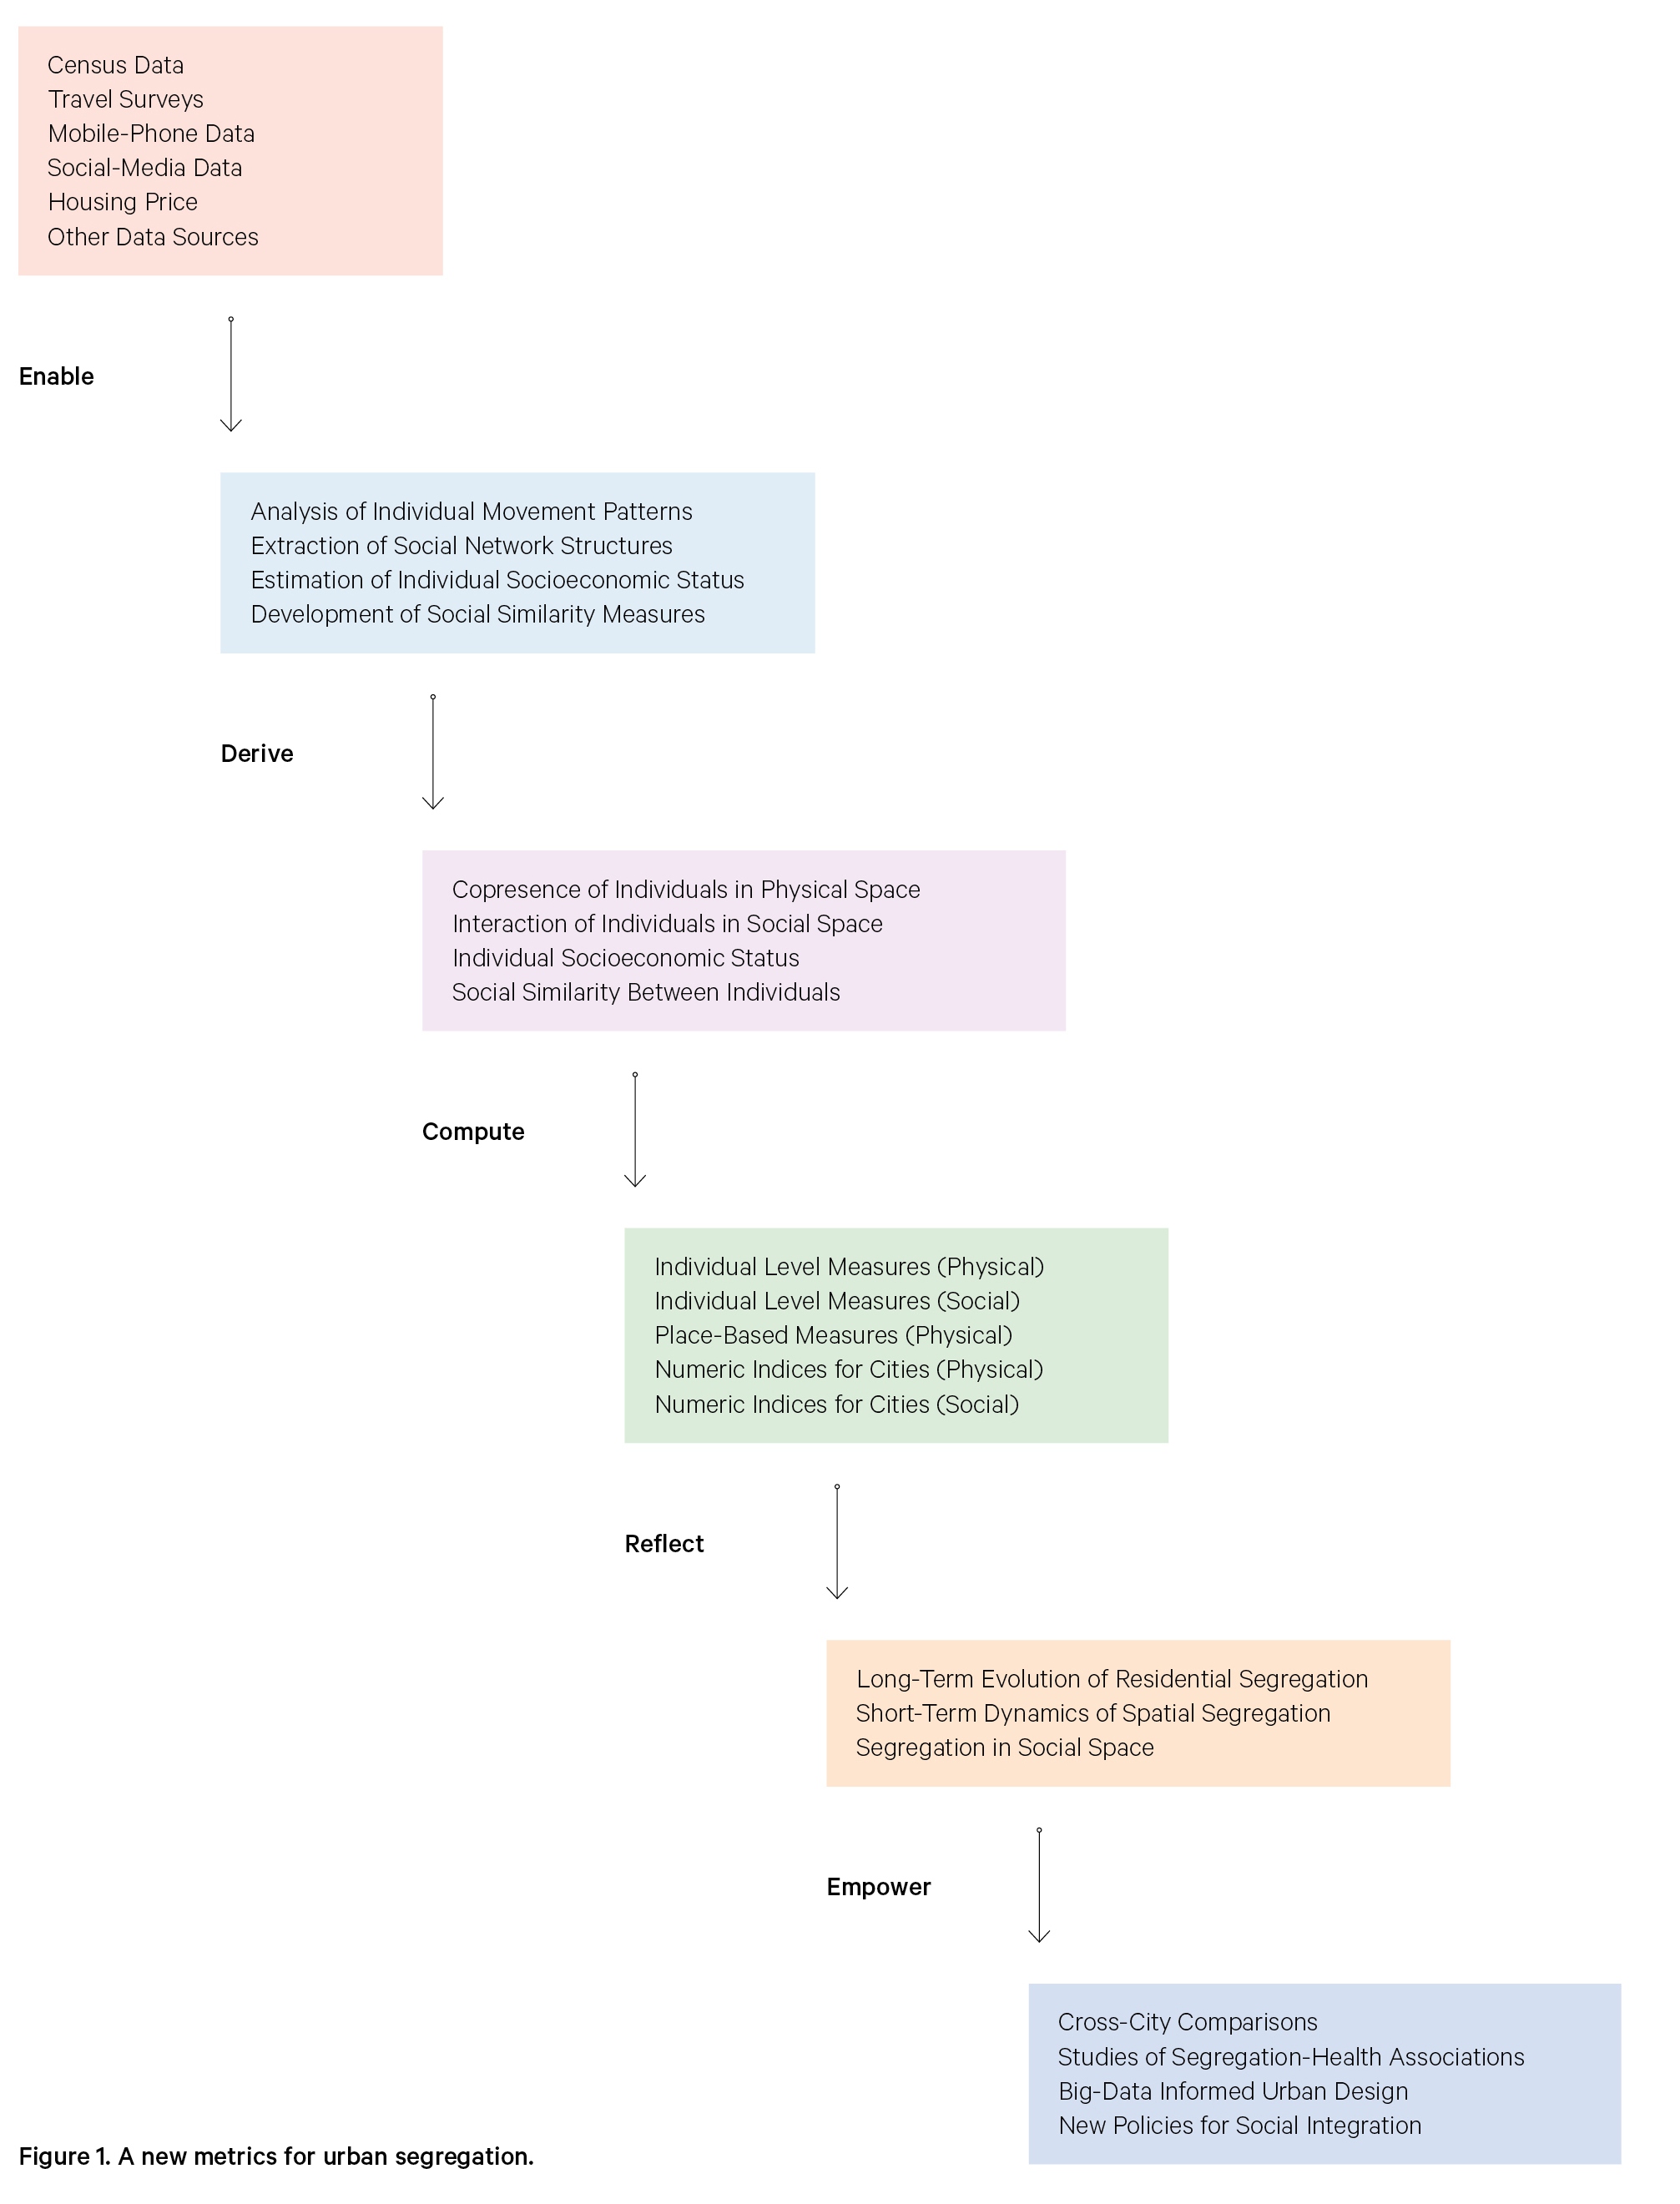
With these new measures, we can monitor not only the long-term evolution, but also the short-term dynamics of urban segregation (orange tier in fig. 1). Our observations will be transformed from physical space to a hybrid physical-social space. The ways we quantify segregation will be enriched to include not only aggregate measures, but also individual-level measures. Such a metrics could generate new momentum for academic research and, more importantly, produce numerous social benefits (dark-blue tier in fig. 1).
Shaping Cities for Social Integration
Social segregation is deeply rooted in many cities worldwide, and it can become more pronounced in the future as urbanization accelerates. Overcoming this issue, however, has never been easy. Factors that breed urban segregations are complicated, usually involving historical, political, and economic forces that are closely intertwined. The emerging urban datasets and the proposed metrics, as we believe, could yield a more comprehensive view of socioeconomic mixings in cities. This can not only inspire new practices for improving urban integration, but also help evaluate the effectiveness of existing measures.
Although the ways of quantifying segregations are becoming more diverse, we should always bear in mind the persistent impact of residential segregation on societal well-being. The “orthodox” urban planning, as criticized by American activist Jane Jacobs, results in zoning restrictions and gentrification that tear urban societies apart. The metrics proposed in this article could empower decision-makers to better understand the behavioral dynamics of people who live in socially isolated areas, for example, to assess their segregation levels during daytime as well as in social space. This will move us beneath the surface of residential segregation, from which new policies and intervention strategies can be developed.
Creating diverse public spaces that bridge different socioeconomic classes is something cities should pursue. Building walkable cities with small street blocks, as advocated by Jane Jacobs, could possibly facilitate social interactions while reinforcing informal surveillance by the “eyes on the street.” With this new metrics, we can analyze different design principles—by correlating place-based segregation measures with built environment indicators (for example, block size, road network density, and land use diversity)—to evaluate the impact of public spaces on social integrations.
Creating diverse public spaces that bridge different socioeconomic classes is something cities should pursue. Building walkable cities with small street blocks could possibly facilitate social interactions while reinforcing informal surveillance by the “eyes on the street”
On the mobility side, cities could consider building transportation links that cover areas that are less easily accessible. The cable-car system implemented in Medellín, Columbia, is a successful example that improves the connections between the city’s informal settlements and the others. The improvements in transit services could strengthen the interactions among urban locations, which enhance the location choices of people, especially the disadvantaged groups. Of course, such improvements should come along with relevant policies, for example, providing affordable housing to the less affluent population and creating mixed-income neighborhoods.
As Internet and mobile technologies proliferate, facilitating online social integration has become more important than ever before. Regulations should be carried out to ensure that online information (for example, job opportunities) is equally accessible to different social groups, and, meanwhile, to create virtual communities that bridge people of different kinds.
Our world is experiencing rapid urbanization. Behind the fast development of contemporary cities, our urban environments are confronted with tremendous social and economic inequality. Integration is at the core of cities since their emergence over 10,000 years ago. Only if we are able to measure to what extent this primordial function still performs and—when needed—implement correct measures can we move toward a safe urban future.
Acknowledgments
We acknowledge support from the Research Grant Council of Hong Kong (project no. 25610118) and the Hong Kong Polytechnic University Start-Up Grant (project no. 1-BE0J).
Bibliography
—Åslund, O., and Skans, O. N. 2010. “Will I see you at work? Ethnic workplace segregation in Sweden, 1985–2002.” ILR Review 63:3, 471–493.
—Blumenstock, J., Cadamuro, G., and On, R. 2015. “Predicting poverty and wealth from mobile-phone metadata.” Science 350:6264, 1073–1076.
—Cortese, C. F., Falk, R. F., and Cohen, J. K. 1976. “Further considerations on the methodological analysis of segregation indices.” American Sociological Review 630–637.
—Duncan, O. D., and Duncan, B. 1955. “A methodological analysis of segregation indexes.” American Sociological Review 20:2, 210–217.
—Ellis, M., Wright, R., and Parks, V. 2004. “Work together, live apart? Geographies of racial and ethnic segregation at home and at work.” Annals of the Association of American Geographers 94:3, 620–637.
—Fry, R., and Taylor, P. 2012. “The rise of residential segregation by income.” Washington, DC: Pew Research Center (202), 26.
—Hellerstein, J. K., and Neumark, D. 2008. “Workplace segregation in the United States: Race, ethnicity, and skill.” The Review of Economics and Statistics 90:3, 459–477.
—Johnston, R., Poulsen, M., and Forrest, J. 2005. “On the measurement and meaning of residential segregation: A response to Simpson.” Urban Studies 42:7, 1221–1227.
—Krings, G., Calabrese, F., Ratti, C., and Blondel, V. D. 2009. “Urban gravity: A model for inter-city telecommunication flows.” Journal of Statistical Mechanics: Theory and Experiment2009:07, L07003.
—Le Roux, G., Vallée, J., and Commenges, H. 2017. “Social segregation around the clock in the Paris region (France).” Journal of Transport Geography 59: 134–145.
—Leo, Y., Fleury, E., Alvarez-Hamelin, J. I., Sarraute, C., and Karsai, M. 2016. “Socioeconomic correlations and stratification in social-communication networks.” Journal of The Royal Society Interface 13:125, 20160598.
—Massey, D. S., and Denton, N. A. 1987. “Trends in the residential segregation of Blacks, Hispanics, and Asians: 1970–1980.” American Sociological Review 802–825.
—Massey, D. S., and Denton, N. A. 1988. “The dimensions of residential segregation.” Social Forces 67:2, 281–315.
—Musterd, S., Marcińczak, S., Van Ham, M., and Tammaru, T. 2017. “Socioeconomic segregation in European capital cities. Increasing separation between poor and rich.” Urban Geography 38:7, 1062–1083.
—Musterd, S., and Van Kempen, R. 2009. “Segregation and housing of minority ethnic groups in Western European cities.” Tijdschrift voor economische en sociale geografie 100:4, 559–566.
—Reardon, S. F. 2009. “Measures of ordinal segregation.” In Occupational and Residential Segregation, Yves Flückiger, Sean F. Reardon, and Jacques Silber (eds.). Bingley: Emerald Publishing, 129–155.
—Reardon, S. F., and O’Sullivan, D. 2004. “Measures of spatial segregation.” Sociological Methodology 34:1, 121–162.
—Sanou, B. 2016. ICT Facts and Figures 2016. International Telecommunication Union.
—Silm, S., and Ahas, R. 2014. “The temporal variation of ethnic segregation in a city: Evidence from a mobile-phone use dataset.” Social Science Research 47: 30–43.
—Taeuber, K. E., and Taeuber, A. F. 1976. “A practitioner’s perspective on the index of dissimilarity.” American Sociological Review 41:5, 884–889.
—Theil, H. 1972. Statistical Decomposition Analysis: With Applications in the Social and Administrative Sciences (No. 04; HA33, T4).
—United Nations. 2014. World Urbanization Prospects: The 2014 Revision, Highlights. Department of Economic and Social Affairs, Population Division, United Nations.
—White, M. J. 1986. “Segregation and diversity measures in population distribution.” Population Index 198–221.
—Williams, D. R., and Collins, C. 2001. “Racial residential segregation: A fundamental cause of racial disparities in health.” Public Health Reports 116:5, 404.
—Xu, Y., Belyi, A., Bojic, I., and Ratti, C. 2017. “How friends share urban space: An exploratory spatiotemporal analysis using mobile-phone data.” Transactions in GIS 21:3, 468–487.
Comments on this publication