This chapter begins by describing the concepts of human development, poverty and inequality under this new conceptualization –intrinsically linked but describing different characteristics of well-being. It then presents recently developed indices that are widely used to measure these phenomena and discusses several methodological considerations of their implementation. In particular, the chapter focuses on the Multidimensional Poverty Index (MPI), a measure that complements more traditional monetary measures of poverty by recognizing that this phenomenon has many forms and dimensions.
Development, Poverty and Inequality: Changing the Development Paradigm
Development, poverty and inequality are different although intrinsically connected concepts. They are at the heart of Amartya Sen’s Capability Approach and the UNDP human development approach, and they all have an impact on people’s well-being.
Development has been traditionally associated to economic growth. This view was challenged by Sen’s Capability Approach which introduced a paradigm shift in the way we understand development (Sen 1979a, 1985a, 1985b, 1987, 1989). This new development paradigm was constructed on two fundamental changes with respect to the previous approach. Development is now focused on the person as the unit of analysis instead of the economy, and the space in which progress is assessed is made of capabilities and freedoms instead of income. Thus, the basic question to ask when comparing societies is ‘What is each person able to do and be?’ – that is, Sen’s approach goes beyond the total average well-being in a society, and rather looks at the opportunities available to each person. As Nussbaum (2011) notes, the approach “is focused on choice or freedom, holding that the crucial good societies should be promoting (…) a set of opportunities, or substantial freedoms, which people then may or may not exercise in action”.
Several practical consequences emerged from this change of paradigm. The focus on persons meant moving from the concept of development to that of human development.
These multiple dimensions of human development are flexible, meaning that every cultural and national context may have a different set of relevant dimensions (Sen, 2004). Finally, policy making changed drastically as it is now oriented to improve several dimensions to advance human development, such as education, health, living conditions, and not just to increase the income level of the economy.
Human development is nowadays described as expanding people’s freedoms, where freedoms entail the worthwhile capabilities people value, and empowering people to engage actively in development processes on a shared planet (Alkire, 2010). Capabilities are understood as the actual ability to achieve something. For instance, the capability to enjoy healthcare requires a health clinic with staff and medical supplies, and that patients are not refused treatment due to gender, race, age, or religion reasons.
The understanding and measurament of development shifted from one dimension, i.e. income, to multiple dimensions, i.e. capabilities and freedoms.
The enlarging of people’s freedoms and the empowering of people are not enough to conceptualize human development. The pursuit of advanced and long lasting human development is made within a context of several constraints including resources, time, information, technology, political will, uncertainty, and institutional capacity. Consequently, the introduction of some procedural principles is also needed (Sen, 1979b, 1992, 1996). For instance, a growth boom that generates large gains for the richest keeping stable the outcomes of low and middle classes would, strictly speaking, be an expansion of human development, because it expanded the capabilities of some persons without impacting negatively on the freedom of any other. However, if there is a policy able to generate gains for the very poor while keeping outcomes of the richest unchanged, that policy would be preferred. Procedural principles thus help to set priorities and to rule out undesirable outcomes (Alkire, 2002; Sen, 2009). Examples of these principles are poverty reduction, efficiency, equity, sustainability, respect for human rights and responsibility.
What are the appropriate policies to improve human development? Economic growth is not strictly necessary, and it is not sufficient (Bourguignon et al., 2008). Some complementary policies have been suggested to achieve durable and long-term human development advances. They include stronger institutions, the formation of sustainable development networks, a strong and vocal civil society, stronger national accountability through countervailing powers and increased global governance and responsibility, and increased international assistance in some contexts (UNDP, 1992, 1999, 2002, 2005).
Moving now into poverty, this concept has been traditionally defined using only one monetary dimension – typically, income level or consumption. In this one-dimensional approach, poverty is defined and measured as the percentage of the population whose income level (for instance, the per capita family income or the equivalence adjusted family income) is below certain poverty line or threshold defined in monetary terms.1
The concept of poverty was also impacted by Sen’s Capability Approach. According to Sen, poverty is a complex and multidimensional concept which needs to take into consideration people’s diverse characteristics and circumstances. The poor generally lack not only income, but education, health, justice, credit and other productive resources, and opportunities. Thus, poverty should be seen as deprivation of capabilities, which then limits the freedoms to achieve something, rather than lowness of income. Sen argues that social evaluation should be based on the extent of the freedoms that people have to further the objectives that they value. Poverty in this framework becomes a ‘capability failure’ – people’s lack of the capabilities to enjoy key ‘beings and doings’ that are basic to human life. The concept is inherently multidimensional.
Two immediate consequences arise from conceptualizing poverty as the deprivation of capabilities. The first one is the recognition of a negative association between poverty and human development, and ultimately between poverty and people’s well-being. The second is a practical one and entails measurement issues. Conceiving poverty as a multidimensional phenomenon implies several challenges in terms of both information requirements (data on several dimensions is now needed in order to calculate a multidimensional poverty measure) and value judgments (the relative importance of the various dimensions needs to be defined). This is particularly relevant within the 2030 Agenda, as the Sustainable Development Goals (SDGs) launched in 2015 require countries to reduce poverty in “all its forms and dimensions”. These aspects will be covered in detail in Section 2.
Last but not least, the concept of inequality refers to how certain variables are distributed among persons, groups of persons, or countries. Traditionally, inequality has been focused on measuring the spread of the distribution of outcome variables, such as level of income, educational achievement, or health status, using well known measures such as the Gini coefficient, the Atkinson index, the Theil index, and percentiles ratios.
Sen’s Capability Approach also reached the concept of inequality. In Sen’s framework, equalizing outcomes should not be a goal, because not all people convert outcomes into well-being in the same way. The relation between outcomes and people’s well-being depends on circumstances beyond people’s control, such as age, gender, family background and disability. It also depends on social conditions, like health care systems, educational systems, prevalence of crime, and community relationships, among other factors. Thus, the goal should be to equalize the opportunities people have to practice their freedoms, and not the outcomes people obtain. In this framework, inequalities of opportunities are seen as constraints to people’s choices and freedoms, impacting negatively on their human development and well-being (UNDP, 2005).
To sum up, human development, poverty and inequality are all essentially multidimensional and people-centered concepts. They all focus, although in different ways, on people’s capabilities having an ultimate impact on people’s well-being. Human development involves expanding the set of capabilities; poverty refers to the deprivation of capabilities, while inequality entails people having different abilities to choose and different freedoms. All these concepts have been shaped by Sen’s Capability Approach, which brought drastic changes in policy making and important measurement challenges.
Measurement aspects: Adding the Different Dimensions
The appearance of Sen’s Capability Approach as a new paradigm to understand human development, poverty and inequality meant a shift in the measures used to capture these concepts.
The goal (in terms of inequality) should be to equalize the opportunities people have, and not the outcomes people obtain.
(Drèze and Sen, 2013). New and innovative measures have been introduced since the beginning of the nineties. Most of them share the features of allowing cross-country comparisons and including multiple dimensions in their calculation. Some of them are the Human Development Index (HDI),2 the Coefficient of Human Inequality,3 and the Multidimensional Poverty Index (MPI).4
All these measures differ in two important respects. First, they differ in the aspect of a given population they aim to measure – i.e. the population of a village, state, country, region, or a specific population sub-group. Some indicators capture the size or overall level of achievements among the analyzed population. For instance, we can calculate the total income or total years of schooling enjoyed by every person of the population. Usually, the average value is calculated to allow the comparison across groups. Following the example, we would calculate the income per capita or the average years of schooling of the population. Other measures are focused on the spread or range of the distribution of achievements. These types of measures capture how equal or unequal is the distribution of achievements for a given population. Finally, other measures capture the base of the distribution or share of the population having an unacceptable low level of achievements according to some standard(s).
The HDI is an example of a size-type measure. The current HDI is based on GNI per capita, average years of schooling, average school life expectancy, and average life expectancy. Each of these dimensions is the average achievement across the population of interest. Indices like the Gini index, the Atkinson index, the Theil index, or the 90:10 ratio are all spread-type measures which provide information on the inequality of achievements in a society. A more recent example of a spread-type index is the Coefficient of Human Inequality, which has been included in the Human Development Reports alongside the HDI since 2014. This index is computed as the unweighted average of the inequality observed in the three dimensions that compose the HDI (education, health and income), where this inequality is measured by the Atkinson index. Finally, the MPI is a base-type measure which captures the nature and magnitude of overlapping deprivations in health, education and living standard for each household. The distinction between size, spread and base-type measures is important. In practice, they provide information on different aspects of a population’s achievements and most importantly, there is no need to choose among them. On the contrary, they complement each other (UNDP, 2010; Alkire and Santos, 2014).
Second, these new measures also differ in their core structure to include four methodological features: dimensional analysis, decomposition, linkages across dimensions, and weighting scheme. Regarding the dimensional analysis, the HDI launched in 1990 was the first measure using multiple dimensions in its calculation. In addition to income, it included information on education and health. With the passing of time, the variables used to describe human development extended to include other topics such as political rights, freedom of action, productivity, gender parity, and sustainability, among others (Alkire, 2010).
The decomposition feature of a measure refers to the possibility of disaggregating it by relevant variables, such as gender, age group, ethnicity, rural-urban area, and disability, among others (Alkire and Foster, 2016). This exercise is highly valued by policy makers who, using information on the intra-country variation of a measure, can shape their policy responses. Moreover, the decomposition feature is needed to define who are the poorest among the poor and how their situation is changing. This is critical to fulfill the SDGs, and its premise of ‘Living No One Behind’. The MPI is an example of a measure satisfying the decomposition property as it can be disaggregated by any subgroup for which the data are representative. Section 4 presents the MPI by regions, groups of countries classified by income level, age groups, and disabilities.
The methodological feature of linkages across dimensions comprises the analysis of which achievements are simultaneously enjoyed by which persons. This feature is present in counting-based multidimensional measures, such as the MPI. This index is an overall aggregate multidimensional measure which can be broken back down to show which people are experiencing which deprivation at the same time. This is possible because the construction of the MPI begins at the level of the individual or household, and builds a profile of their deprivations for each dimension and person. From this profile, a person is then identified as poor/not poor. In contrast, composite measures offer only an indirect understanding of the linkages between dimensions because they combine different aggregated indicators which may come from different surveys. The HDI is an example of a composite measure.
The last methodological feature of the measures refers to the weighting vector applied to aggregate the different dimensions. In practice, people may disagree about which weights to use. People are diverse, and values may differ across people and for the same person over time (Sen, 2009). However, it is not necessary for people to agree on a set of weights. The important aspect is that any policy recommendation must be robust to a range of plausible weights, and the weighting vector used should be made explicit and should be easy to understand (Alkire et al., 2011).
The next sections take the MPI as a case study of a measure following the new paradigm of development. This index supports the recognition that poverty has many forms and dimensions, and that measures complementing traditional poverty indices are needed.
Multidimensional Poverty Index: The Theory
Until recently, many countries measured poverty only as the lack of income or consumption. But no one indicator can capture the multiple aspects of poverty. The Global MPI is an internationally comparable measure of acute poverty developed by OPHI and the United Nations’ Human Development Report Office (HDRO). The Global MPI complements monetary measures of poverty by reflecting the acute simultaneous deprivations that people face in other dimensions which are also essential to guarantee a dignified life. Following the HDI, the MPI shares the same three dimensions: education, health and living standards. The Global MPI was released in 2010, and has been updated regularly and published in every Human Development Report subsequently.
The Global MPI is one particular adaptation of the adjusted headcount ratio (M0) proposed in Alkire and Foster (2011) and elaborated in Alkire et al. (2015). The AlkireFoster (AF) methodology is a general framework for measuring multidimensional poverty, although it is also suitable for measuring other phenomena (Alkire and Santos, 2013). With the AF method, many key decisions are left to the user, such as the selection of the unit of analysis, dimensions, deprivation cutoffs (to determine when a person is deprived in a dimension), weights (to indicate the relative importance of the different deprivations), and poverty cutoff (to determine when a person has enough deprivations to be considered poor). This flexibility enables the methodology to have many diverse applications, though it has been mainly used to measure multidimensional poverty.5
Alkire-Foster method. Alkire and Foster (2011) propose a methodology based on the counting approach, which makes adjustments to the traditional FGT family of indicators to bring it to a multidimensional space. This methodology introduces two cutoffs in the identification stage of the poor.
First, the set of indicators which will be considered in the multidimensional measure is selected. Data for all indicators need to be available for the same household. The achievement matrix contains then the level of achievement of each household in each indicator included in the measure.6 Then, the deprivation cutoffs for each indicator need to be set – namely, the level of achievement considered sufficient (normatively) in order to be non-deprived in each indicator. After applying these cutoffs, each household is identified as either deprived or non-deprived in each indicator. More formally,
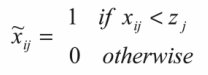
where Xij is the value of achievement of household i in indicator j; z is the deprivation cutoff for indicator j, and ![]() is a dichotomous variable that takes value =1 if household i is deprived in indicator j, and =0 otherwise. The achievement matrix transforms then into the deprivation matrix, which contains the
is a dichotomous variable that takes value =1 if household i is deprived in indicator j, and =0 otherwise. The achievement matrix transforms then into the deprivation matrix, which contains the ![]() variables for each indicator/household.
variables for each indicator/household.
At this stage, the relative weight or value that each indicator has is applied, such that these sum to one or 100%. In this way, the dichotomous variables which take values 0 or 1 are multiplied by the weight of each indicator to obtain the weighted deprivation matrix.
As indicated by Alkire and Foster (2011), “dimension specific cutoffs alone do not suffice to identify who is poor; we must consider additional criteria that look across dimensions to arrive at a complete specification of the identification method”. To do this, once established who is deprived in each indicator, this method counts the number of attributes in which household i is deprived: the counting vector, Ci, represents then the sum of weighted deprivations faced by each household.
Here, the second threshold k is set. It defines who is multidimensionally poor and who is not. In other words, k represents the minimum number of weighted indicators in which a household must be deprived to be considered as multidimensionally poor. Thus, we have: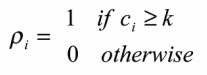
where ρi is a dichotomous variable that takes value =1 if household i is deprived in at least k weighted indicators. This method allows using the union and intersection approaches, setting k = 1 and k = d , respectively (where d is the number of indicators included in the analysis). Similarly, an intermediate approach is also allowed setting a value of k between these extremes. That is, the union and intersection approaches can be taken as special cases of this method. Alkire and Foster (2011) do not provide an algorithm for determining k, but rather consider the results with all possible values of k between 1, and d as a kind of robustness test of the estimations.
In addition to these considerations at the stage of identifying the poor, the authors propose adjustments to add the information of households in a population indicator, based on the FGT family of indices. In particular, the AF method first computes the proportion of people who have been identified as multidimensionally poor in the population. This is the headcount ratio of multidimensional poverty H, also called the incidence of multidimensional poverty:
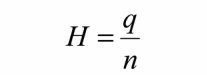
where q is the number of households identified as multidimensionally poor using the dual cutoff and n is the total number of households. Then, the average share of weighted indicators in which poor people are deprived is computed. This entails adding up the deprivation scores of the poor and dividing them by the total number of poor people. This is the intensity of multidimensional poverty A, also sometimes called the breadth of poverty:
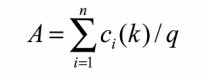
This partial index conveys relevant information about multidimensional poverty, in that households that experience simultaneous deprivations in a higher fraction of dimensions have a higher intensity of poverty and are poorer than others having a lower intensity.
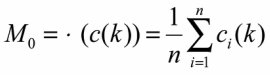
Finally, the M0 or MPI is computed as the product of the two previous partial indices: H x A. Analogously, it can be obtained as the mean of the vector of deprivation scores, which is also the sum of the weighted deprivations that poor people experience, divided by the total population. This means that the final measure M0 considers the headcount of poverty in the traditional way, but adjusts it by the intensity of poverty to get a more complete picture of poverty. This correction allows the indicator to verify the multidimensional monotonicity property (which is not satisfied with the rate of incidence).7 More formally,
The measures of the AF family satisfy many of the desirable properties for poverty measures. Several properties are key for policy. The first is decomposability, which allows the index to be broken down by population subgroups (such as region, gender or ethnicity) to show the characteristics of multidimensional poverty for each group. As discussed in the previous section, the MPI satisfies population subgroup decomposability. Thus, the poverty level of a society is equivalent to the population-weighted sum of subgroup poverty levels, where subgroups are mutually exclusive and collectively exhaustive of the population.
The MPI can also be unpacked to reveal the dimensional deprivations contributing the most to poverty for any given group. This second key property – post-identification dimensional breakdown – is not available with the standard headcount ratio and is particularly useful for policy.
In addition, the MPI also has an intuitive interpretation: it reflects the proportion of weighted deprivations the poor experience in a society out of the total number of deprivations this society could experience if all people were poor and were deprived in all dimensions. Additionally, the MPI is related to a set of consistent and intuitive partial indices, namely, the poverty incidence (H), intensity (A), and a set of subgroup poverty estimates and dimensional deprivation indices (which in the case of the M0 measure are called censored headcount ratios) and their corresponding percent contributions. Each measure can be unfolded into an array of informative indices.
Another practical advantage of the MPI is that it can be implemented with ordinal data. This is critical for real-world applications. It is relevant when poverty is viewed from the capability perspective, for example, since many key functionings are commonly measured using ordinal variables. The M0 or MPI satisfies the ordinality property. This means that for any monotonic transformation of the ordinal variable and associated cutoff, overall poverty as estimated by M0 will not change.
Example of the AF method8
Suppose there is a hypothetical society containing four people and multidimensional poverty is analyzed using four indicators: income, years of education, Body Mass Index (BMI), and access to improved sanitation. The 4×4 matrix X contains the achievements of the four people in the four indicators.
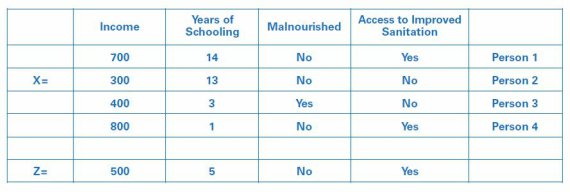
For example, the income of Person 3 is 400 units, whereas Person 4’s is 800 units. Person 1 has completed 14 years of schooling, whereas Person 2 has completed thirteen years of schooling. Person 3 is the only person who is malnourished of all four persons. Two persons in our example have access to improved sanitation. Thus, each row of matrix X contains the achievements of each person in each of the four indicators. The deprivation cutoff vector is denoted by z = (500, 5, Not malnourished, Has access to improved sanitation), which is used to identify who is deprived in each indicator. The achievement matrix X has three people who are deprived (see the underlined entries) in one or more indicators. Person 1 has no deprivation at all.
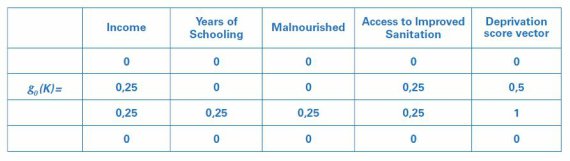
Based on the deprivation status, we construct the deprivation matrix g0, where a deprivation status score of 1 is assigned if a person is deprived in an indicator and a status score of 0 is given otherwise.
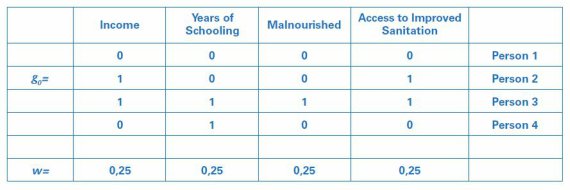
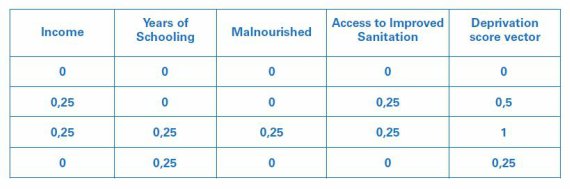
All indicators are equally weighted in this example and thus the weight vector is w = (0.25, 0.25, 0.25, 0.25). We then apply these weights to the deprivation matrix to obtain the weighted deprivation matrix. The weighted sum of these status scores is the deprivation score (Ci) of each person. For example, the first person has no deprivations and so the deprivation score is 0, whereas the third person is deprived in all indicators and thus has the highest deprivation score of 1. Similarly, the deprivation score of the second person is 0.5 (0.25 + 0.25).
The union identification approach identifies a person as poor if the person is deprived in any of the four indicators. In that case, three of the four people in this example are identified as poor (i.e. persons 2, 3 and 4). On the other hand, the intersection approach requires that a person is identified as poor if she is deprived in all indicators. In that case, only one of the four people is identified as poor (i.e. person 3). An intermediate approach sets a cutoff between the union and intersection approaches, say, k = 0.5, which is equivalent to being deprived in two of four equally weighted dimensions. This strategy identifies a person as poor if she is deprived in half or more of weighted indicators, which in this case means that two of the four people are identified as poor (i.e. persons 2 and 3).
Once the poor have been identified, the weighted deprivation matrix is censored so that the measure can focus only on the deprivations of the poor – that is, deprivations of those identified as non-poor are replaced with a zero. This leads to the censored deprivation matrix and the censored deprivation score, as shown below for k = 0.5.
 Note that there is one case where the censoring is not relevant: when the poverty cutoff corresponds to the union approach, then any person who is deprived in any dimension is considered poor, and the censored and original matrices are identical.
As discussed above, the headcount ratio H is the proportion of people who are poor, which is two out of four persons in the above matrix. That is, H = 2/4 = 1/2 or 50%.
The intensity A is the average deprivation share among the poor, which in this example is the average of 0.5 and 1 (i.e. the deprivation scores of the two people that are poor, persons 2 and 3). That is, A = 0.75 or 75%.
It is easy to see that the adjusted headcount ratio M0 (or MPI) = H x A = 0.5 x 0.75 = 0.375. It is also straightforward to verify that M0 is the average of all elements in the censored deprivation score vector c(k), i.e. M0 = (0 + 0.5 + 1 + 0) / 4 = 0.375. Analogously, it is equivalent to compute as the weighted sum of deprivation status values divided by the total number of people: M0 = (0.25*2 + 0.25*1 + 0.25*1 + 0.25*2) / 4 = 0.375.
Following the explanations above, the analysis can be completed by computing decompositions by populations subgroups and dimensional breakdowns.
Multidimensional Poverty Index:The Practice
One specific application of the AF method has been the Global MPI, which is an internationally comparable measure of acute poverty in over 100 developing countries.9 As already mentioned, the Global MPI was developed by OPHI and the HDRO, and launched in 2010. It has been updated annually and bi-annually by OPHI, and included in every Human Development Report since then. The aim of the Global MPI is to inform policy through comparable information on multidimensional poverty for the developing world. In this sense, the selection of dimensions, indicators and other parameters is guided by this purpose, as well as by the available information for this large number of countries. The Global MPI is alike the USD 1.90/day measure of monetary poverty by the World Bank, providing and international benchmark and allowing for comparability. This measure uses the household as the unit of identification, meaning that indicators are defined at the household level and all members share the same status of deprivations.
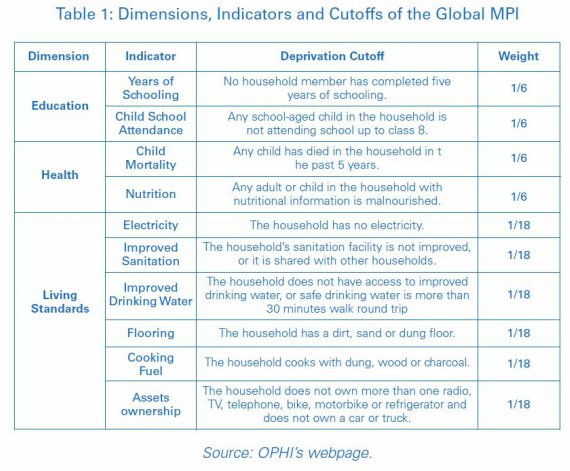
The Global MPI includes three dimensions and 10 indicators (Table 1). Each dimension has equal weight and indicators within dimensions receive an equal weight. The poverty cutoff is defined as one third, meaning that a person is multidimensionally poor if he/she is deprived in at least 1/3 of the weighted sum of deprivations.
 The most recent figures of the Global MPI were launched in 2017. They covered 5.4 billion people, or 76% of the world’s population, living in 103 countries. The following paragraphs describe the main findings of the 2017 Global MPI reported by Alkire and Robles (2017).
A total of 1.45 billion people of the 103 countries covered by the 2017 Global MPI are multidimensionally poor. This figure represents 26.5% of the population of these countries.
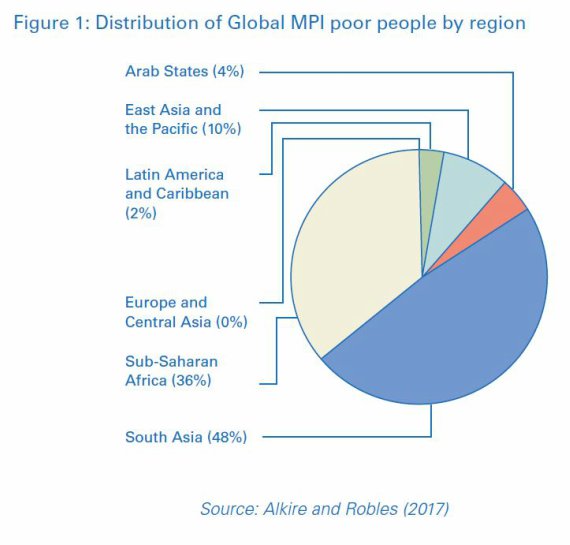
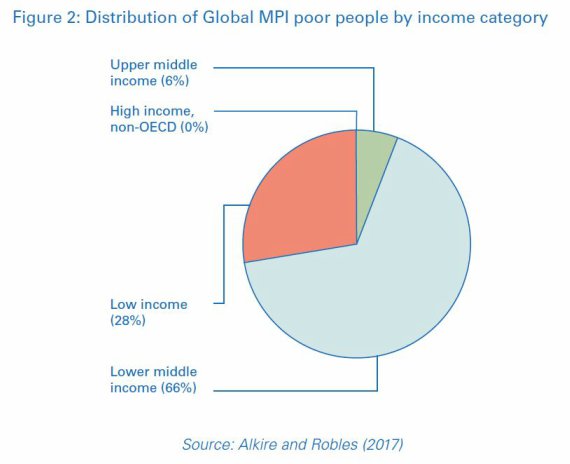
The regional disaggregation of the index indicates that South Asia and SubSaharan Africa are the regions with higher shares of world multidimensional poor people: 48% of the poor people live in South Asia and 36% in Sub-Saharan Africa (Figure 1). An interesting result is obtained when comparing the level of the MPI index in these regions with the traditional USD 1.90/day poverty measure. In South Asia, 41.6% of the population is multidimensionally poor, while the extreme income poverty measure is less than half of that value (19.2%). In SubSaharan Africa, multidimensional poverty affects 60.1% of the population, while the monetary measure of poverty reaches 46.4%. When countries are classified according to their income levels, the disaggregation of the MPI indicates that almost three quarters of all multidimensionally poor people (72%) are located in middle income countries, and the remaining 28% in low income countries (Figure 2).
This change of paradigm meant focusing on the person as the unit of analysis instead of economy, and assessing progress in the space of capabilities and freedoms instead of income.
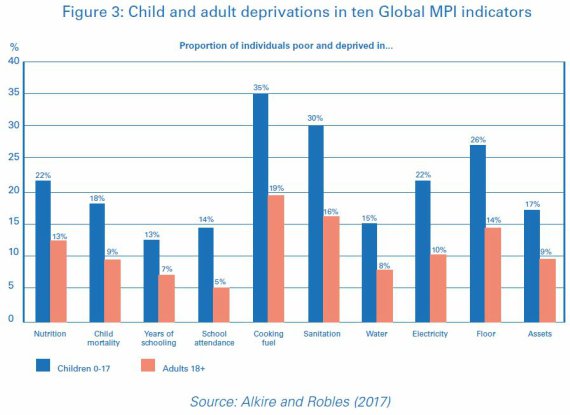
When the index is broken down by age groups, the findings indicate that a large share of the multidimensionally poor people is composed of children (0 17 years old), and that the MPI is especially high among them. Specifically, 48% of multidimensionally poor people are children, and 37% of children are multidimensionally poor. Most MPI poor children live in South Asia (44%) and in Sub-Saharan Africa (43%). The analysis of the individual dimensions indicates that poor children are on average deprived in 52% of weighted indicators. The most common deprivations children face are in cooking fuel, sanitation, flooring, malnutrition and electricity (Figure 3).
The Global MPI has been recently disaggregated by disability status for the case of Uganda (Pinilla and Alkire, 2017). Findings show that households with at least one member with a severe disability faced higher levels of multidimensional poverty – MPI of 77% compared with 69% among households with disavility.
Since 2014, a measure of destitution has been incorporated to the analysis. This measure identifies a subset of the MPI poor who are the poorest of the poor. As of 2017, nearly half of all MPI poor people live in destitution. The same set of dimensions, indicators, weights and poverty cutoff are used to identify those who are destitute, but the destitution deprivation cutoffs are more extreme. They include severe malnutrition, losing two or more children, having a child out of primary school, having no household member who has completed more than one year of schooling, using open defecation, fetching water that is unsafe or 45 or more minutes away, not owning even a mobile phone or radio, and cooking with wood or dung or straw only.
Interestingly, there are pockets of destitution even in countries with low levels of MPI (Figure 4). For instance, in countries like Turkmenistan, Bosnia and Herzegovina, Barbados, Uzbekistan and Azerbaijan, 30% or more of MPI poor people are destitute. In South Africa, less than 9% of the MPI poor are destitute. In general, destitution rates tend to be lower than the USD 1.90/day poverty rates. But destitution is markedly higher than income poverty in some countries, such as Pakistan, Mauritania, Sudan, Gambia, Chad, Ethiopia, Niger, and South Sudan. This finding highlights the importance of measuring and fighting poverty in all its forms and dimensions. On the negative side, there are six countries where destitution is ‘the norm’ affecting half of more of the population.
All in all, the last Global MPI figures provide a comprehensive description of deprivations in multiple dimensions for the developing world. Around a quarter of the population in these countries are multidimensionally poor, almost half of all MPI poor are children, there is a positive association between disability status and multidimensional poverty, and nearly half of all MPI poor people face severe deprivations.
Final remarks
The Capability Approach developed by Nobel Laureate Amartya Sen implied a paradigm shift in the understanding of human development, poverty and inequality, and deeply impacted the way in which we have analyzed and measured these phenomena in the last two decades.
The concept of development turned into human development, measures of development, poverty and inequality shifted from one dimension to multiple dimensions, and policy making changed drastically in the direction of improving several dimensions to advance human development and not just increasing the income level of the economy. Following the launch of the Human Development.
Index (HDI) in 1990, several new indices have been created following this shift to a broader understanding of human development.
This chapter provided a description of the concepts of human development, poverty and inequality under this new conceptualization – intrinsically linked but describing different characteristics of well-being. It then presented recently developed indices that are widely used to measure these phenomena and discussed several methodological considerations of their implementation.
In particular, the chapter focused on the Multidimensional Poverty Index (MPI), a measure that complements more traditional monetary measures of poverty by recognizing that this phenomenon has many forms and dimensions. First, it provided details on the Alkire and Foster methodology for measuring multidimensional poverty. Then, it discussed the more recent figures of the Global MPI, a specific application of the Alkire and Foster method which provides a comprehensive description of deprivations in multiple dimensions for the developing world. The Global MPI is an internationally comparable measure of acute multidimensional poverty. Following the structure of the HDI, it is composed by three dimensions – education, health and living standards, and 10 indicators.
All dimensions are equally weighted, and indicators within dimensions receive an equal weight. A person needs to be deprived in a third of weighted indicators to be identified as multidimensionally poor.
As of 2017, the Global MPI indicates that around a quarter of the population in the 100+ countries analyzed are multidimensionally poor; this represents a total of 1.45 billion people. In addition, almost half (48%) of all MPI poor are children aged 0-17. Findings also revealed that there is a positive association between disability status and multidimensional poverty, and that nearly half of all MPI (706 million) poor people are destitute facing severe deprivations.
All these findings provide valuable information to shape policy responses in the context of the 2030 Agenda. The SDGs adopted by world leaders represent a general acknowledgement of the broader understanding of human development presented in this chapter. They urge countries to fight poverty all its dimensions. They set a premise that countries should leave no one behind in their efforts for progress. They emphasize the need for a better understanding of the interlinkages across many indicators, which is key to design multisectoral-coordinated policy interventions. The SDGs will most likely lead to the implementation of new metrics that allow going beyond the traditional measures and can guide interlinked responses across many sectors. These new tools, used jointly with existing ones like the HDI and MPI, could lead to more effective and precise targeted policies that improve the living conditions of those who are still facing severe challenges in their lives.
References
Alkire, S. (2002). Valuing freedoms. Sen’s capability approach and poverty reduction. New York, Oxford: Oxford University Press.
Alkire, S. (2010). “Human Development: Definitions, Critiques, and Related Concepts”. Background paper for the 2010 Human Development Report. Oxford Poverty and Human Development Initiative, University of Oxford.
Alkire S. and J. Foster (2016). “Dimensional and Distributional Contributions to Multidimensional Poverty”. OPHI Working Paper 100. Oxford Poverty and Human Development Initiative, University of Oxford.
Alkire, S., and J. Foster (2011). “Counting and multidimensional poverty measurement”, Journal of Public Economics, 95(7 8), 476-487.
Alkire, S., J. Foster, S. Seth, M.E. Santos, J.M. Roche and P. Ballon (2015). Multidimensional Poverty Measurement and Analysis, Oxford University Press.
Alkire, S., Foster, J. and Santos, M.E. (2011). “Where did identification go?”. Journal of Economic Inequality, 9(3), pp. 501–505.
Alkire, S. and G. Robles (2017). “Global Multidimensional Poverty Index”. Briefing 47. Oxford Poverty and Human Development Initiative, University of Oxford.
Alkire, S. and M.E. Santos (2014). “Acute Multidimensional Poverty: A New Index for Developing Countries”. World Development, 59, pp. 251-274.
Bourguignon, F., Bénassy-Quéré, A., Dercon, S., Estache, A., Gunning, J. W. and Kanbur, R. (2008). “Millennium Development Goals at Midpoint: Where do we stand and where do we need to go?”. Background paper for European Report on Development 2009.
Drèze, J. and Sen, A.K. (2013). An Uncertain Glory: India and Its Contradictions. London: Allen Lane.
Foster, J., J. Greer and E. Thorbecke (1984). “A class of decomposable poverty measures”. Econometrica 52, 761–776.
Nussbaum, M. (2011). Creating capabilities: the human development approach. Cambridge, Massachusetts; London, England: Harvard University Press, 2011.
Pinilla-Roncancio, M. and Alkire, S. (2017). “How poor are people with disabilities around the globe? A multidimensional perspective”. OPHI Research in Progress 48a, Oxford Poverty and Human Development Initiative, University of Oxford.
Sen, A.K. (1979a, 1979b, 1985a, 1985b). “Equality of What?”. In Sterling M. McMurrin (ed.), The Tanner Lectures on Human Value, pp: 195-220. Salt Lake City: University of Utah Press. “Informational Analysis of Moral Principles”. In R. Harrison (ed.), Rational Action, pp. 115-132. Cambridge: Cambridge University Press.Commodities and Capabilities. Oxford: Elsevier Science Publishers. “Well-being, Agency and Freedom: the Dewey Lectures”. Journal of Philosophy, 82(4), pp. 169-221.
Sen, A.K. (1987, 1989, 1992, 1996, 1999, 2004, 2009). The Standard of Living: The Tanner Lectures. Cambridge: Cambridge University Press. “Development as Capability Expansion”. Journal of Development Planning, 17, pp. 41-58. Inequality re-examined. Cambridge: Harvard University Press. “On the foundations of welfare economics: Utility, capability and practical reason”. In F. Farina, F. Hahn and S. Vannucci (eds.), Ethics, Rationality, and Economic Behaviour, pp. 50-65. Oxford: Oxford University Press. Development as freedom. New York: Knopf.
UNDP. (1992,1999, 2002). “Human development report 1992,1999, 2002: Global dimensions of human development”. New York: Oxford University Press.
UNDP. (2005). “Human development report 2005: International cooperation at a crossroads: aid, trade and security in an unequal world”. New York: Hoechstetter Printing Co.
UNDP (2015). “Transforming Our World: The 2030 Agenda for Sustainable Development”.
Notes
1 Other measures of poverty that can be obtained using the FGT family of indices developed by Foster, Greer and Thorbecke (1984) also look at the gap between people’s income level and the poverty line (i.e. poverty gap), or the square of this gap (i.e. breath of poverty).
3 http://hdr.undp.org/sites/default/files/hdr2016_technical_notes.pdf
4 http://www.ophi.org.uk/multidimensionalpoverty-index/
5 The AF method has also been used to develop an index of women empowerment, Bhutan’s Gross National Happiness Index and wellbeing measures. For more information, see OPHI’s website.
6 In this matrix, each row represents a different household, while columns correspond to each indicator included in the measure. For instance, if we were considering the case of four households and six indicators, the matrix’s size would be 4×6 (i.e. four rows and six columns). The first cell, [1,1], would represent the level of achievement of household 1 in indicator 1; the second cell in the first row, [1,2], would represent the achievement of household 1 in indicator 2, and so on.
7 The multidimensional monotonicity implies that if a poor household starts to suffer hardships in an indicator in which it previously did not, global poverty should increase. In the traditional incidence rate this is not verified.
8 Taken from Alkire et al. (2015).
9 The AF method has also been applied by national governments for the development of National MPIs, tailoring the decision on dimensions, indicators, thresholds and other parameters to the national priorities. More information on this can be found at: http://www.ophi.org.uk/research/multidimensional-poverty/policyapplications/
Comments on this publication