Creativity has attracted the attention of researchers in a variety of disciplines including behavioural psychology and management. Within the field of psychology the focus has been primarily on the relationship between creativity and such individual attributes as intelligence, knowledge and personality (Barron and Harrington, 1981; Helson, 1996; Sternberg, 1988; Sternberg and Lubart, 1991; Weisberg, 1993). In the management literature the focus has been more on how creativity emerges from the interaction between the individual employee and various aspects of management style and work organisation. Woodman, Sawyer, and Griffin (1993), for example, see creativity as resulting from the interaction of individual, group and organizational variables. Amabile et al. (1996) similarly focus on social and organizational factors, arguing in particular that creativity at work is supported by organizational and supervisory encouragement as well as by a diversity of ideas within the work group (Bharadwag and Menon, 2000; Drazin, Glynn and Kazanjian, 1999; and Ford, 1996).
Although there has been some work on the cultural or systemic basis of creativity (Csikszentmihalyi, 1988; Lubart, 1999), prior to Richard Florida’s publication of The Rise of the Creative Class (2002), relatively little attention has been given to analysing the basis for and the impact of creativity at the levels of regions and nations. By putting forward creativity as the driving force of economic growth, and by presenting the rise of creativity as a general account of the current transformation of the economy comparable to the knowledge-based economy hypothesis, Florida’s research has done more than any of the more specialised research to bring creativity to the forefront of debate in the social sciences. Further, in a series of empirical studies focusing on the relationship between investments in human capital, creativity and regional economic performance, Florida and his co-authors have argued that the creative class provides a new and alternative standard to the level of educational attainment for measuring human capital in studies focusing on regional development (Florida, Mellander and Stolarick, 2008; Mellander and Florida, 2006).
Drawing inspiration from Florida’s research as well as from the more specialised research on creativity in the fields of behavioural psychology and management, this paper sets out firstly to provide what we believe to be the first mapping of creativity at work for the 27 member nations of the European Union. We show that there are significant national differences in the likelihood of employees being involved in creative work activity even after adjusting for national differences in occupational and industrial structure.
Referring to recent research that extends the perspective on national systems of innovation to include the organisation of work, labour market characteristics and education systems (Hall and Soskice 2001; Lam and Lundvall, 2006; Lorenz and Lundvall 2006; Lundvall, 2002; Whitley 2006), we then explore by means of aggregate correlations at the national level the relationship between creativity at work and characteristics of national labour markets and systems of education and training. Among the key findings presented in this paper is that the level of creative work activity tends to be higher in nations with broad competence-based systems of education and training that place value on equality of access to life-long learning opportunities and the continuing acquisition of job-related skills. The level of creativity also tends to be higher in nations characterised by the combination of high levels of labour market mobility and well-developed systems of unemployment protection (flexible security) and with active labour market policies.
The chapter is structured as follows. Section 2 develops the mapping of the importance of creative workers for the EU-27. Section 3 demonstrates that there are significant differences in the frequency of creative work activity across nations after adjusting for differences in occupation and industrial structure. Section 4 examines the relationship between creativity and measures of national labour market structures and systems of education and training. Section 5 concludes and briefly alludes to implications for EU policy.
Measuring the creative workforce
A major theme in the behavioural psychology literature on creativity is that of ’eminence’ or being ‘unique in the whole world’, and there are a number of empirical studies of creativity focusing on the lives of truly exceptional musicians, artists or scientists. In contrast to this focus on eminence, there is a body of research focusing on ‘everyday’ or ‘local’ creativity of the sort that a large percent of the working population engage in during their daily work activity (Reilly, 2008; Craft, 2005; Richards 1996).
Florida’s notion of the creative class corresponds to this latter, more broadly distributed, form of creativity. In Florida (2002), he states that the distinguishing characteristic of the creative class is that its members “engage in work whose function is to create meaningful new forms” (p. 68). The highest level of creative work, characteristic of what Florida refers to as the ‘super-creative core’, involves “producing new forms or designs that are readily transferable and widely useful…” (p. 69). This group includes such occupations as scientists, university professors, poets and architects. Beyond this core, Florida includes within the creative class a diverse group of professionals who, “engage in creative problem-solving, drawing on complex bodies of knowledge to solve specific problems.” He observes, “What they (creative professionals) are required to do regularly is think on their own.” (p. 69). Further, he notes that many technicians are included in the creative class as they, “apply complex bodies of knowledge to working with physical materials” and in a number of fields, “are taking on increased responsibility to interpret their work and make decisions…” (pp. 69-70).
As the above references show, Florida’s notion of the creative class is an economic one based on the kinds of work activities or jobs that different occupational categories typically undertake. Consistent with this, and in order to measure the size of the creative class and its growth over time for the US economy, he draws on the occupational classifications and figures compiled by the US Bureau of Labor Statistics. Based on standard characterisations of skill requirements for different jobs, occupations are grouped into the creative, service or working classes. The creative class is defined to include most management occupations, professionals and selected categories of technicians and assistant professionals.3 Florida (2002: 75, 330) estimates that the creative class increased from 3 million workers or 10% of the workforce in 1900 to 38.3 million or 30% in 1999. In 1999, the working and service classes are estimated at 26.1 and 43.4 % of the work force respectively, with agriculture making up the remaining 0.5%.
While this way of measuring the size of the creative workforce is appropriate for capturing broad changes in the importance of creativity within an economy over time, it has a number of limitations that make it unsuitable for an internationally comparative analysis. Firstly, as Florida’s discussion of the creative factory emphasises (Florida, 2002: 52), creativity can extend down from the firm’s management and technical services to the shop floor, and highly creative firms typically seek to mobilise the knowledge and skills of the entire workforce. The blanket characterisation of the work of operators, sales and service staff and craft workers as non-creative is at odds with a vast literature on ‘learning organisations’ that emphasize the collective and multi-level nature of learning and creativity at the workplace.
Second, there is a well-established internationally comparative literature which identifies important national effects on the organisation of work. In particular, detailed international comparisons show that the jobs and work activity of the same occupational categories can display significant national variations, requiring more or less learning and problem-solving activity and differences in responsibility and autonomy (Dore, 1973; Gallie, 1978; Lane, 1989; Lorenz and Valeyre, 2005; Maurice et al., 1982). The findings of these detailed international comparisons of enterprise organisation are consistent with the work on national systems of innovation that links the micro-dynamics of learning and knowledge creation to differences in national labour markets and education and training systems.
Third, work on sectoral systems of innovation (Malerba, 2002) points to important differences in the technological dynamism of different sectors of the economy and thus it can be anticipated that the work of the same occupational categories will display marked differences in terms of problem-solving activity and creativeness according to the sector. This implies a need to take into account differences in industrial structure across nations in any statistical analysis of the determinants of creativity at the workplace.
In order to develop a measure of the creative workforce that is suitable for a comparative analysis of the EU-27, we draw on the results of the 4th EWCS conducted by the European Foundation for the Improvement of Living and Working Conditions in 2005. The survey questionnaire was directed to approximately 1000 active persons in each country with the exception of Cyprus, Estonia, Luxembourg, Malta and Slovenia, which had approximately 600 respondents. The total population surveyed was 29,679 occupied persons.4 The analysis presented here is restricted to the 9,198 salaried employees working in establishments with at least 10 employees in both industry and services, but excluding agriculture and fishing, public administration and social security, education, health and social work, and private domestic employees. In order to develop a measure of the creative workforce that is consistent with Florida’s (2002) characterisation of the creative class, we use factor analysis to identify the underlying associations that exist among six binary variables that capture key features of creative work activity (see Table 1).5 We then use hierarchical clustering in order to group the population into three basic types of workers: creative workers, constrained problems solvers and workers with Taylorist jobs.6
Table 1. Creative work variables
Source: Fourth Working Conditions Survey, 2005, European Foundation for the Improvement of Living and Working Conditions
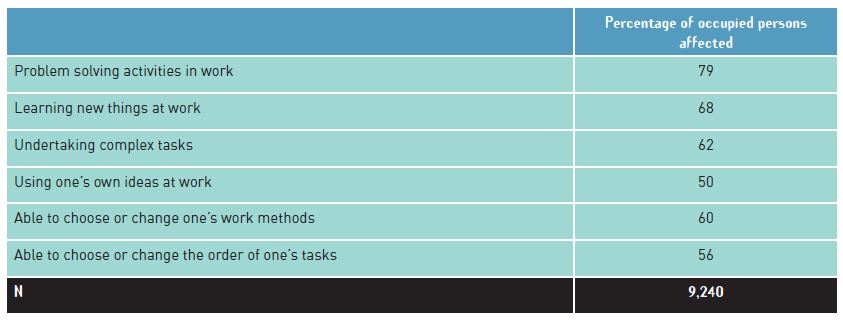
Table 1 shows the percentage of the population characterised by the six work-activity variables that are used in order to classify a worker as creative. Thus, as Florida observes, creative workers typically engage in complex problem-solving activities. Further, workers who use their own ideas in settings where they exercise considerable discretion over their work methods or task order correspond to the distinguishing creative feature of being able to, “think on their own” and to take on, “increased responsibility to interpret their work and make decisions”. These six work activity variables do not, however, provide a basis for discriminating between the creative workforce as a whole and the ‘super creative core’ which Florida defines in terms of the outcome of producing transferrable and widely-used new forms or designs.
Table 2. Cluster analysis of types of workers
Source: Fourth Working Conditions Survey, 2005, European Foundation for the Improvement of Living and Working Conditions
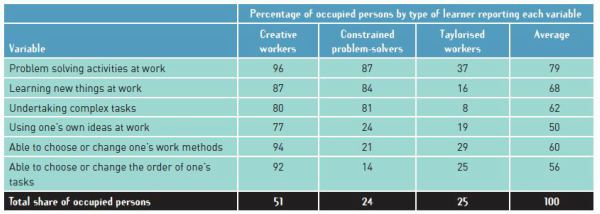
Table 2 shows the composition of the three groups resulting from the hierarchical cluster analysis. The first group, which accounts for 51% of the population, is distinctive for high levels of problem-solving, learning and task complexity. The persons grouped in this cluster use their own ideas and exercise considerable autonomy in carrying out their jobs. We refer to them as ‘creative workers’. The second group is characterised by nearly as high levels of problem- solving and learning and comparable levels of task complexity. However, there is little use of one’s own ideas, and levels of autonomy or discretion at work are low. This cluster groups employees who, while regularly solving technical or other problems at work, do so in highly supervised settings offering little scope for developing original or creative solutions based on their own ideas. We refer to them as ‘constrained problem solvers’. The third group is composed largely of persons doing deskilled work. Levels of learning, problem-solving and task complexity are low. There is little use of one’s own ideas and there is limited scope for exercising discretion in how work is carried out. We refer to this group as ‘Taylorised workers’.
Table 3. Type of Worker by Sector of Activity
Source: Fourth Working Conditions Survey. European Foundation for the Improvement of Living and Working Conditions
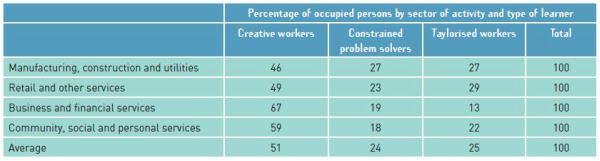
Table 3 shows that there are variations in the importance of creative learners according to industrial sector. In particular, creative learners are over-represented in business services and in community, social and personal services, while they are under-represented in manufacturing, construction and retail and other services.
Table 4. Type of Worker by Occupational Category
Source: Fourth Working Conditions Survey, European Foundation for the Improvement of Living and Working Conditions
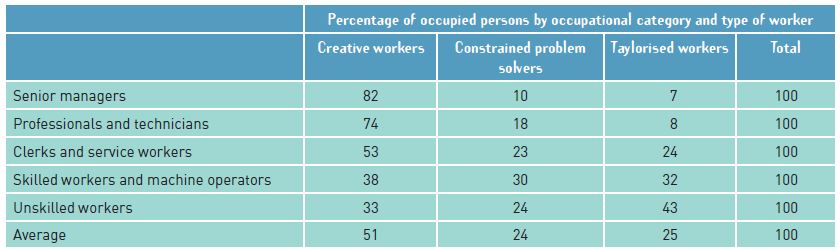
Table 4 points to the considerable diversity that exists in the importance of creative work across broadly defined occupational categories. Although the large majority of senior managers, professionals and technicians, which make up the bulk of Florida’s creative class, are highly over-represented in the creative workers cluster, roughly half of the occupations making up the clerks and sales and service category, who form Florida’s service class, engage in creative work activity. Moreover, a significant minority of the manual occupations making up Florida’s working class engage in work requiring creative learning, problem-solving and the use of one’s own ideas. The results shown in Table 4 point, for the EU at any rate, to the limitations of using standard occupational categories as the basis for identifying the group of workers who are creative at work. Significant proportions of service and manual workers may work in settings where they are called upon to make creative use of their own ideas.
National effects
Table 5 identifies important differences in the size of the creative workforce across the EU-27. Creative workers are most present in the Scandinavian countries, Finland, the Netherlands and Malta and least present in Spain, Greece, Italy, Cyprus, the Czech Republic, Hungary, Lithuania, Poland, Slovakia, Bulgaria and Romania. There are intermediate levels of creative work activity in the continental European nations, the UK and Ireland, Portugal and amongst the new member nations in Estonia, Latvia, and Slovenia. The frequency of Taylorised workers tends to show the reverse trend to that of creative workers, being lowest in the Scandinavian countries, the Netherlands and Malta, and highest in the southern nations, Cyprus, the Czech Republic, Hungary, Lithuania, Slovakia, and Bulgaria. The frequency of constrained problem solvers is relatively high in Greece, in the new member nations with the exception of Latvia, and Slovenia and to a lesser extent Lithuania.
Table 5. National differences in Types of Learners: EU27 (percentage of occupied persons by country and type of learner)
Source: Fourth Working Conditions Survey, 2005. European Foundation for the Improvement of Living and Working Conditions
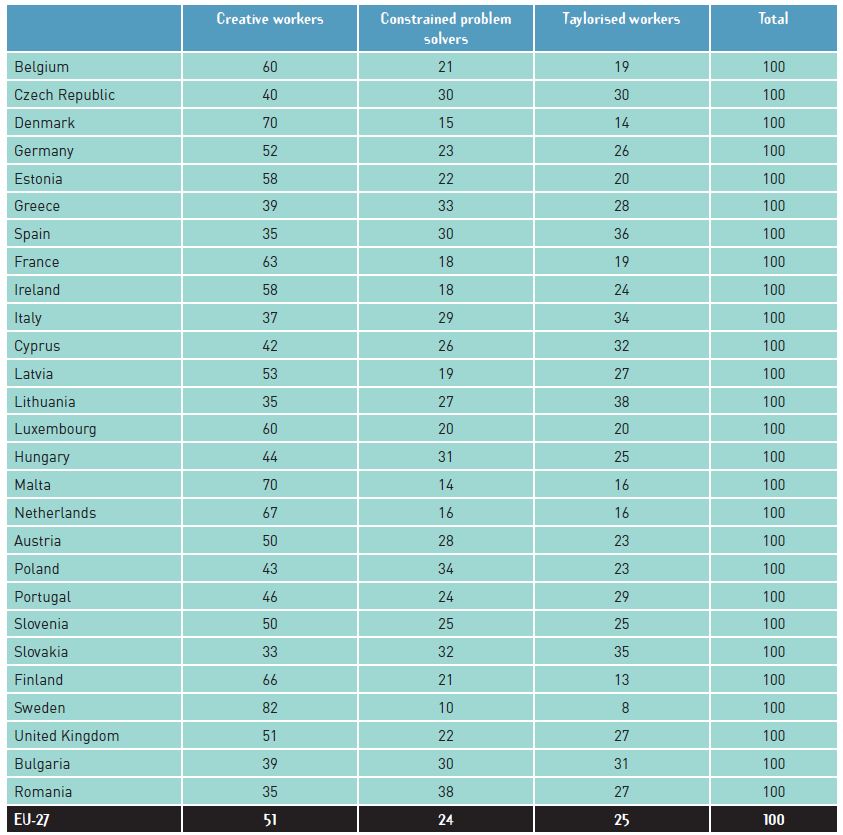
Table 3 shows that the frequency of creative work activity varies across broadly defined sectors of activity, and some of the national differences in the importance of creativity shown in Table 5 may be attributable to cross-national differences in industrial structure. It is also possible that international differences in occupational structure may explain some of the differences in the frequency of creative work across the member nations of the EU. In order to control for the effects of these structural variables, we have undertaken a logistic regression analysis explaining the likelihood that an employee is engaged in creative work in terms of nation, industrial sector and occupation. The results are presented in Table 6.
Table 6. Logit estimates of national effects on creative work activity
* significant at 5% level;
** significant at 1% level.*
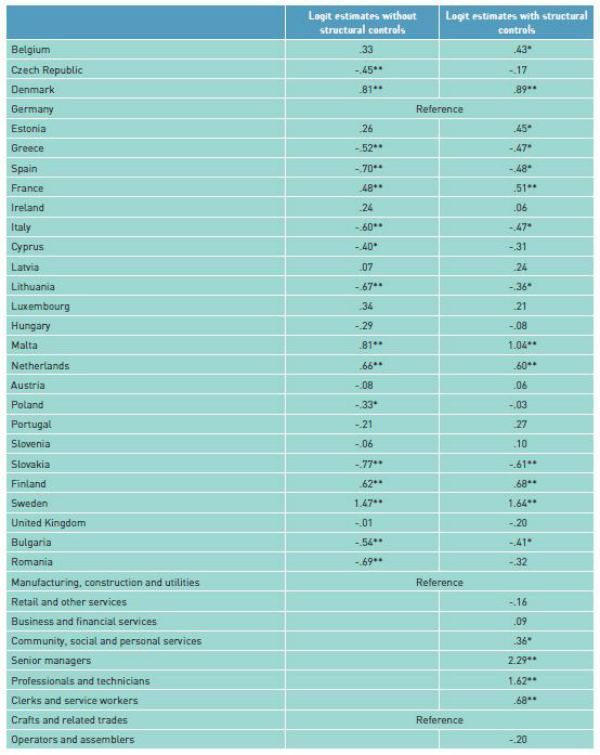
The results presented in the first column of Table 6 show national effects on the likelihood of creative work without structural controls and the second column shows the results with these controls. Germany, which has a profile of types of learners close to the EU-27 average, is used as the reference case. The results thus show whether or not creative work activity is significantly more likely in a nation relative to the German case.
The first column results (without structural controls) show that creative work is significantly more likely in the Nordic countries, Netherlands, Malta and France. Expressed in odds ratios an employee working in Sweden is 4.4 times as likely as an employee in Germany to be engaged in creative work activity. The likelihood of creative work is not significantly different in the continental nations with the exception of France, and the likelihood is significantly lower in the southern nations with the exception of Portugal for which the difference is not significant. Creative work activity is less likely in a number of the new member nations including Lithuania, Poland, Slovakia, the Czech Republic, Bulgaria and Romania. Expressed in odds ratios, the likelihood of creative work is only .46 times as likely in Slovakia as it is in Germany.
The second column results report national effects after taking into account the effects of cross-national differences in the structure of sectors, occupational categories and establishment size. Most of the national effects reported in column one remain the same in terms of the direction of the sign and statistical significance. The exceptions are Belgium and Estonia for which the positive coefficients are now significant at the 5% level, and Cyprus, Poland and Romania for which the negative coefficients are no longer significant at the 5% level or better. Considering the control variables, we can see that relative to manufacturing and mining creative work is more likely in community, social and personal services, while for business and financial services and retail and other services there are no significant differences. As expected, creative work activity is more likely for senior managers and professionals relative to skilled workers and machine operators, and it is also more likely for clerks and sales workers relative to skilled workers and machine operators. Expressed in terms of odds ratios, senior managers are nearly six times as likely to be engaged in creative work activity and professional and technicians are about four times as likely. Sales staff and clerks are about twice as likely as skilled workers and operators to be engaged in creative work activity.
Creativity, labour market structure and systems of education and training
The analysis above has shown that there are significant differences in the importance of creative work activity across the member nations of the European Union. Relatively little attention has been given in the literature to how national-level institutional arrangements may impact on creativity at the workplace. Although creativity at work might be influenced by a wide range of institutional conditions, in this exploratory analysis we focus on a set of complementary institutional arrangements that have received attention in recent work on national innovation systems: the role of broad competence-based systems of education and training; and the role of labour market systems characterised by the combination of high levels of labour market mobility and well developed systems of unemployment protection. (Hall and Soskice, 2001; Lam and Lundvall, 2006; Lorenz and Lundvall, 2006).
National labour market structure
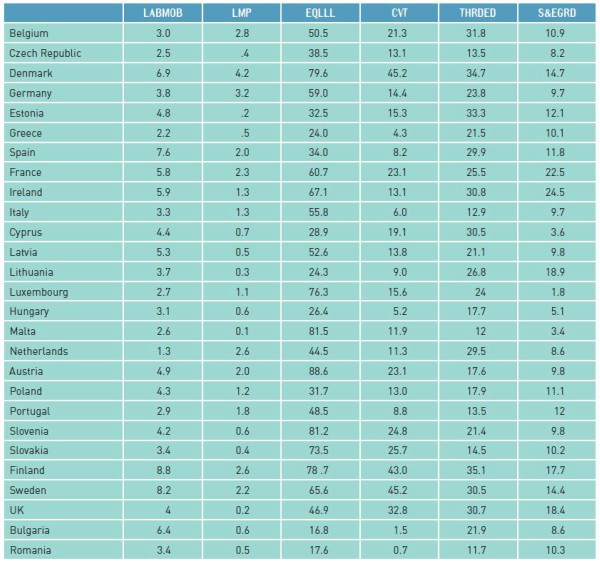
Hall and Soskice (2001) have argued that fluid labour markets characterised by few restrictions on hiring and firing may impact positively on innovative performance because they allow firms to rapidly bring in new knowledge from the outside and to reconfigure their knowledge bases. New knowledge can support creative outcomes, such as developing new products or services, because it provides a foundation for exploring novel solutions and for learning that extends beyond the firm’s existing areas of expertise. In order to explore this hypothesis, we developed a measure of labour market mobility (LABMOB) based on data from the Labour Force Survey on the share of persons by country whose job had started within the last three months. LABMOB is defined as the average of this share over three quarters: the 2nd quarter of 2005 and the 1st and 2nd quarters of 2006.7
While fluid labour markets can contribute to a rapid reconfiguration of a firm’s knowledge base, as Lam and Lundvall (2006) have observed, labour market mobility is a two-edged sword for the creative firm. Highly creative firms draw their capability from the diverse know-how and practical problem- solving skills embodied in individual experts. Formal professional knowledge may play only a limited role and the expert’s problem-solving capabilities have more to do with experience and tacit knowledge generated through interaction, trial-and-error and experimentation. Because these tacit skills cannot be easily codified, the creative firm faces a problem of reproducing what has been learnt into an organizational memory and it is highly vulnerable when it comes to individuals leaving the organisation.
These problems of accumulating and transferring experience-based tacit knowledge take a different form when firms are organised into localised networks and industry clusters. Mobility across organisational borders within industrial clusters contributes to professional and social relationships which provide the ‘social capital’ and ‘information signals’ needed to ensure the efficient accumulation and transfer of tacit knowledge in an inter-firm career framework (Saxenian, 1996). We would argue that such professional and social networks are more likely to arise in institutional settings where high levels of labour market mobility are complemented by well-developed systems of unemployment protection and active labour market policies designed to increase the employability of the unemployed. Unemployment protection can encourage individuals to commit themselves to what would otherwise be considered unacceptably risky career paths that are punctuated by transitions between employment and unemployment or part-time employment. Furthermore, unemployment protection combined with active labour market polices can help assure that extended periods of unemployment will not lead individuals to accept downgrading or accept job offers that do not make use of and build on the experience and knowledge they have gained through previous employment.
For these reasons, it can be argued that labour market mobility is more likely to be skill-enhancing in nations with well-developed systems of unemployment protection combined with active labour market policies. In order to capture the development of such systems of flexicurity (FLXSCR), we use a simple indicator constructed by multiplying LABMOB, the measure of labour market mobility, by LMP, total expenditures on active and passive labour market policies as a percentage of GDP.8
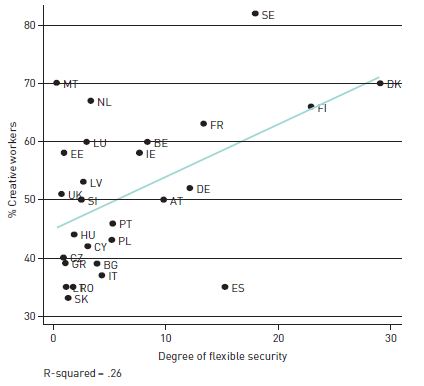
Figures 1 and 2 below present aggregate correlations at the national level showing the relationship between the frequency of creative work activity and the measures of labour market mobility and flexicurity.9 The results support the view that labour market mobility is more likely to foster skill enhancement and creativity at the workplace when it is combined with well-developed systems of unemployment protection combined with active labour market policies. Figure 1 shows a weak and non-statistically significant positive relationship between the frequency of creative work and the measure of national labour market mobility, while Figure 2 shows a stronger and statistically significant positive relationship between the frequency of creative work and the measure of flexible security. Denmark, and to a lesser extent Sweden and Finland, stand out for their relatively high levels of flexible security.
Figure 1. % Creative workers by % labour mobility
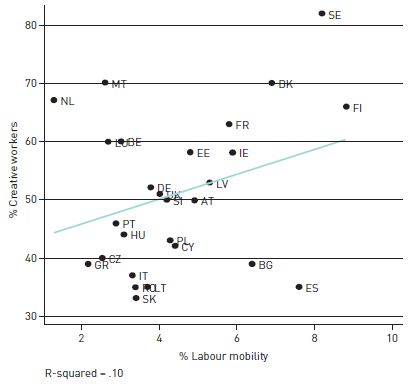
Figure 2. % Creative worker by degree of flexible security
National systems of education and training
Lam and Lundvall (2006) have argued that national systems of education and training can be distinguished by the extent to which they promote an even distribution of competence across occupational categories as opposed to generating wide disparities in skill levels and learning opportunities. Broad competence-based systems are characterised by their concern to balance investment in formal academic education and the production of third-level degrees, with investment in continuous vocational training and with creating possibilities for further training open to all. Such systems are more conducive to decentralised modes of work organisation and favour the forms of interactive learning and the transmission and mobilisation of tacit knowledge that can contribute to creativity at the workplace.
In order to develop measures of the characteristics of national systems of education and training, we used the aggregate data available on Eurostat’s electronic database. We used two measures of the level of a nation’s investments in formal academic knowledge and skills: the percentage of the population with third-level education (THRDED); and the number of science and engineering graduates as a percentage of the 20-29 aged cohort in 2005 (S&EGRD). In order to capture the breadth of the education and training system and the extent to which value is placed on developing practical job-related skills, we used the results of the 2003 Labour Force Survey module on life-long learning.10 As an indicator of the overall level of development of further education and training opportunities, we used the figures on the proportion of the labour force involved in any form of education or training during the four weeks prior to the survey. Equality of access to such further education and training is defined as the ratio of the percentage of skilled trades involved in any form of education or training activity to the percentage of managers, professionals and technicians (EQLLL). Higher ratios would indicate a more even distribution of further education and training across occupational categories.11 The value attached in a nation to developing practical job-related skills and expertise is measured by the proportion of the labour force receiving job-related education or training from providers other than the formal degree-conferring educational system during the four weeks prior to the survey (CVT). This includes continuous vocational training provided by employers.
Figure 3. % Creative workers by % third level education
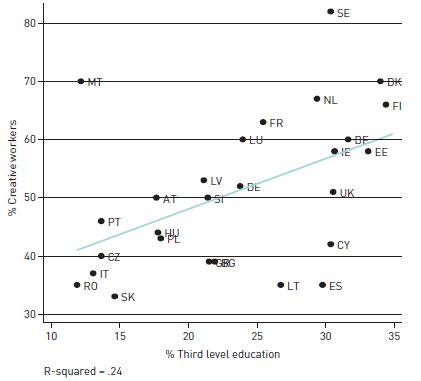
Figure 4. % Creative workers by % science and engineering graduates
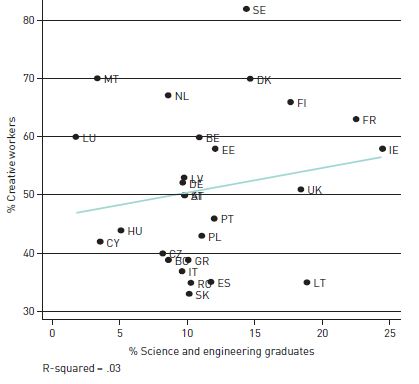
Figures 3 and 4 show the relationship between the frequency of creative work activity and the two measures of investment in formal academic knowledge. The results are mixed. While there is a positive and statically significant relationship between creativity and the importance of third-level education, there is little discernible relation between creativity at work and the importance of third-level science and engineering degrees.
Figure 5. % Creative workers by degree of equality life long learning
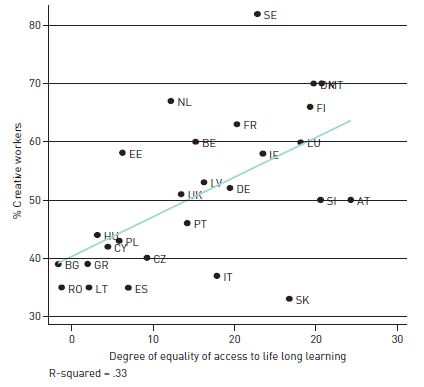
Figure 6. % Creative workers by % continuous vocational training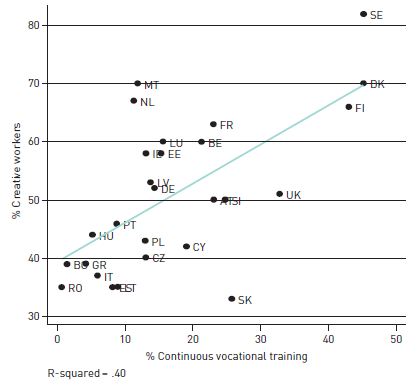
Figures 5 and 6 show the relationship between creative work activity and our two measures of broad competence-based systems of education and training. The results show a positive and statistically highly significant relationship between the frequency of creative work and the measure of equality of access to life-long learning, and an even stronger and statistically significant positive relationship between the frequency of creative work and a nation’s commitment to developing practical job-related skills and expertise.
Overall, while the aggregate correlations suggest that an increase in the resources committed to third-level education in general can promote creativity at work there is little evidence to suggest that insufficient numbers of science and engineering graduates constitute an obstacle to achieving higher levels of creativity at work. Moreover, the results strongly suggest that for many of the new member nations or southern European nations with very low levels of creative work activity the more important bottleneck is their low levels of investment in further education and training.
Conclusion
One of the starting points for this paper was the analysis of ‘the creative class’ as developed by Richard Florida. With reference to his work we used employee-level survey data from European countries to classify workers as more or less involved in creative work activity. A first result is that while the occupational categories used by Florida to define the creative class provide a useful means for measuring the rise in the creative class over time within a single nation, they are misleading for purposes of international comparisons. National location matters and we find important ‘national effects’ on the likelihood of creative work activity after adjusting for the effects of an employee’s occupation and sector of activity. A semi or unskilled operator or service worker has a higher chance of being assigned creative tasks in the Scandinavian nations than in the Eastern or Southern nations.
Such national differences may have different causes and in this paper we link them to institutional differences among the European economies that are related to the further education and training system and to labour market structure. We find that broad competence-based education systems characterised by more equal access to further training for enhancing vocational skills as compared to academic knowledge are associated with higher levels of creative work. We also find that labour markets that combine high mobility with ambitious labour market policy in terms of passive and active measures tend to be associated with higher levels of creative work.
Creativity is arguably an essential factor in a nation’s capacity for knowledge development and innovation and our analysis has implications for public policy in Europe. Using a somewhat different classification of work categories, Arundel et al. (2007) demonstrate that a high frequency of participatory forms of work organisation go hand in hand with more radical innovation within a specific national system. The tendency to operate with narrow perspectives on innovation and innovation systems, where the focus is upon science-driven innovation and neglects experience-based learning and the organisation of work, is misleading (Jensen et al., 2007).
The Spring 2010 European Council emphasised the importance of structural reforms for assuring a strong and sustainable recovery from the current economic crisis and for preserving the sustainability of Europe’s social models. Our results provide important guidance for the direction these should take. The analysis shows that ‘the creative class’ is an elastic category that can be widened to include many ordinary workers. On the basis of our results we would argue that there is a need for institutional reform in Europe in order to create broad-based and egalitarian further education and training systems that are integrated into policies for flexicurity. Such a political mix would serve to spread and deepen creative activities so that they are no longer the privilege of a specific social class. They may also be seen as a way to strengthen the EMU-economies most exposed to global competition and currently under attack from global finance. It would also represent a major step towards aligning the two classical objectives for the Lisbon agenda: competitiveness and social cohesion.
Annex
The figure presents graphically the first two axes or factors of the multiple correspondence analysis (MCA). The first factor, accounting for 42% of the variance in the data set or the chi-squared statistic, distinguishes between creative workers and Taylorised workers. On one side of the axis we find the variables measuring the presence of autonomy, learning, problem-solving, complexity and the use of one’s own ideas, and on the other side we find the variables measuring their absence. The second factor, accounting for 17% of the variance in the data set, is defined by the presence of problem-solving, learning and complexity combined with the absence of autonomy and the use of one’s own ideas at work.
Figure A1. Graphical Representation of first two factors of MCA – 6 Organisational Variables. For the six creative work activity variables,
+ signifies the presence of the feature and – signifies its absence. PBSOLV: problem-solving at work. LEARN: learning new things at
work. IDEAS: use of one’s own idea at work. COMPLX: undertaking complex tasks. AUTMET: choose or change one’s work methods.
AUTORD: choose or change one’s task order.
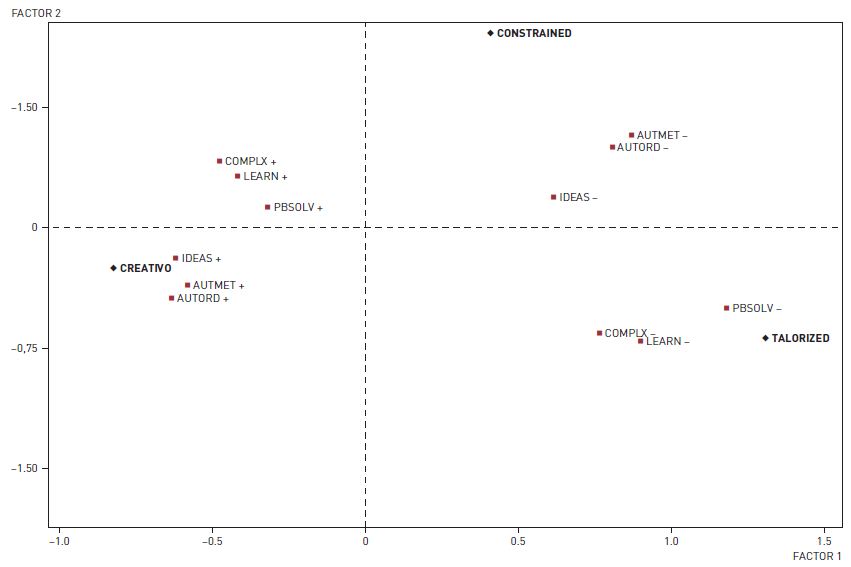
The projection of the centre of gravity of the three worker clusters coming out of the hierarchical classification analysis (see Table 2) onto the graphic representation of the first two factors of the MCA shows that the three clusters correspond to quite different types of work activity. The creative cluster is located to the west of the graph, the Taylorised cluster to the east, and the constrained problem-solving cluster to the south.
Table A1. Survey questions used for the construction of the binary work activity variables
Source: Agnès Parent-Thirion, et al. 2007, pp. 109-134.
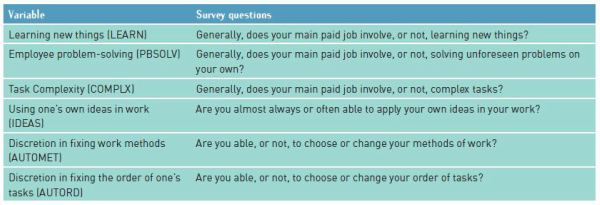
Table A3. Aggregate Indicators: EU-27
Bibliography
Amabile, T. (1988), “A model of creativity and innovation in organizations”, in B. M, Staw and L. L. Cummings (eds.), Research in Organisational Behaviour, Greenwich, CT: JAI Press, vol. 10, pp.123-167.
Amabile, T., R. Conti, H. Coon, J. Lazenby and M. Herron (1996), “Assessing the Work Environment for Creativity”, Academy of Management Journal 39(5), pp. 1154-1184.
Arundel, A., E. Lorenz, B.-Å. Lundvall, and A. Valeyre (2007), “How Europe’s Economies Learn: a Comparison of Work Organization and Innovation Mode for the EU-15”, Industrial and Corporate Change, 16(6), pp. 1175-1210.
Barron and Harrington (1981), “Creativity, Intelligence, and Personality”, Annual Review of Psychology, vol. 32, pp. 439-476.
Bharadwaj, S., and A. Menon (2000), “Making Innovation Happen in Organizations: Individual Creativity Mechanisms, Organizational Creativity Mechanisms or Both?” Journal of Product Innovation Management 17(6), pp. 424 -434.
Craft, A. (2005), Creativity in Schools: Tensions and Dilemmas, Oxford: Routledge Press.
Csikszentmihalyi, M. (1988), “Society, culture, and person: A systems view of creativity” in R. Sternberg (ed.), The Nature of Creativity: Contemporary Psychological Perspectives, Cambridge: Cambridge University Press.
Dore, R. (1973), British Factory, Japanese Factory: The Origins of National Diversity in Industrial Relations, Berkeley: University of California Press.
Drazin, G. and Kazanjian (1999), “Multilevel Theorizing About Creativity in Organizations: A Sense-making Perspective”, The Academy of Management Review, 1999, 24(2), pp. 286-307.
Florida, R. (2002), The Rise of the Creative Class, New York: Basic Books.
Florida, R., C. Mellander and K. Stolarick (2008), “Inside the black box of regional development—human capital, the creative class and tolerance”, Journal of Economic Geography 8, pp. 615–649.
Ford, C. (1996), “A Theory of Individual Creative Action in Multiple Social Domains”, The Academy of Management Review 21(4), pp. 1112-1142.
Gallie, D., In Search of the New Working Class, Cambridge, Cambridge University Press.
Hall, P., and D. Soskice (2001), Varieties of Capitalism, Oxford: Oxford University Press.
Henson, R. (1996),”In Search of the Creative Personality”, Creativity Research Journal 9, pp. 295-306.
Jensen, M. B., B. Johnson, E. Lorenz, and B.-Å. Lundvall (2007), “Forms of Knowledge and Modes of Innovation”, Research Policy 36(5), June 2007, pp. 680-693.
Lam, A., and B.-Å. Lundvall (2006), “The Learning Organisation and National Systems of Competence Building and Innovation” in E. Lorenz and B.-Å. Lundvall (eds.), How Europe’s Economies Learn: Coordinating Competing Models, Oxford: Oxford University Press.
Lane, C. (1989), Management and Labour in Europe, Aldershot: Edward Elgar.
Lorenz, E. and B.-Å. Lundvall (eds.) (2006), How Europe’s Economies Learn: Coordinating Competing Models, Oxford: Oxford University Press.
Lorenz, E., and B.-Å. Lundvall (2010), “Accounting for Creativity in the European Union: A Multi-level Analysis of Individual Competence, Labour Market Structure, and Systems of Education and Training” (forthcoming), Cambridge Journal of Economics.
Lorenz, E., and A. Valeyre (2005), “Organisational Innovation, HRM and Labour Market Structure: A Comparison of the EU-15”, Journal of Industrial Relations, pp. 424-442.
Lundvall, B.-Å. (2002), Innovation, Growth and Social Cohesion: The Danish Model, Cheltenham: Edward Elgar.
Lundvall, B.-Å., and E. Lorenz (2006), “Welfare and Learning in Europe—How to Revitalize the Lisbon Process and Break the Stalemate”, in E. Lorenz and B.-Å. Lundvall (eds.), How Europe’s Economies Learn: Coordinating Competing Models, Oxford: Oxford University Press.
Lubart, T. (1999), “Creativity across cultures”, in R. J. Sternberg (ed.), Handbook of Creativity, Cambridge: Cambridge University Press.
Malerba, F. (2002), “Sectoral Systems of Innovation and Production”‘ Research Policy 31, pp. 247–264
Maurice, M., F. Sellier, J.-J. Silvestre (1986), The Social Foundations of Industrial Power, Cambridge, MA: The MIT Press.
Mellander, C. and R. Florida (2006), “The Creative Class or Human Capital? – Explaining Regional Development in Sweden”, Working Paper Series in Economics and Institutions of Innovation 79, Royal Institute of Technology, CESIS – Centre of Excellence for Science and Innovation Studies.
Parent-Thirion, A., E. Fernández Macías, J. Hurley and G. Vermeylen (2007), Fourth European Working Conditions Survey, European Foundation for the Improvement of Living and Working Conditions, Dublin.
Payne (1990), “The Effectiveness of Research Issues: A review”, in M. West and J. Farr (eds.), Innovation and creativity at work, Chichester, UK: Wiley. pp. 101-122.
Petrakos Agilis, M. (2007), “Quality Report of the 4th European Working Conditions Survey”, European Foundation for the Improvement of Living and Working Conditions, Dublin. http://www.eurofound.europa.eu/publications/htmlfiles/ef0708.htm.
Reilly, R. (2008), “Is Expertise a Necessary Precondition for Creativity? A Case of Four Novice Learning group Facilitators”, Thinking Skills and Creativity 3, pp. 59-76.
Richards, R. (1996), “Beyond Piaget: Accepting Divergent, Chaotic, and Creative Thought”, New Direction for Child Development, 72, pp. 67-78.
Roffe, I. (1999), “Innovation and Creativity in Organisations: a Review of the Implications for Training and Development”, Journal of European Industrial Training 23, pp. 224-241.
Saxenian, A. (1996), Beyond Boundaries: Open Labor Markets and Learning in Silicon Valley, Oxford: Oxford University Press.
Sternberg, R. (ed.) (1988), The Nature of Creativity: Contemporary Psychological Perspectives, Cambridge: Cambridge University Press.
Sternberg, R. J. (ed.) (1999), Handbook of Creativity, Cambridge: Cambridge University Press.
Sternberg, R., and T. Lubart (1991), “An Investment Theory of Creativity and its Development”‘, Human Development 34(1), pp. 1-31.
Weisberg, R. (1993), Creativity: Beyond the Myth of Genius, New York: W.H. Freeman.
Whitley, R. (2006), “Innovation Systems and Institutional Regimes: the Construction of Different Types of National, Sectoral and Transnational Innovation systems”‘ in E. Lorenz and B.-Å. Lundvall (eds.), How Europe’s Economies Learn: Coordinating Competing Models, Oxford: Oxford University Press.
Woodman, R. W., J. E. Sawyer and R. W. Griffin (1993), “Toward a Theory of Organizational Creativity”, Academy of Management Review 18(2), pp. 293-321.
Notes
1 This chapter draws on the analysis in an article that we originally published in the Cambridge Journal of Economics, 2010.
2 See R. J. Sternberg (ed.), 1999, for an overview of the literature.
3 Florida’s measure of the creative class is based on the 1998 Standard Occupational Classification (SOC) system which, in common with the International Standard Classification of Occupations (ISCO), groups jobs together in occupations and more aggregate groups mainly on the basis of the similarity of skills required to fulfil the tasks and duties of the jobs. For the list of occupational categories included in the creative class see Florida (2002: 328-329). In terms of the ISCO used by the European Union, Florida’s creative class is composed of Management Occupations (ISCO 12-13), Professionals (ISCO 21-24) and some of the occupations classified as Technicians and Associate Professionals (ISCO 31-34). The service class is composed of Clerks (ISCO 41-42), Service Workers (ISCO 51-52) and Sales and Service Elementary Occupations (ISCO 91). The working class is composed of Craft and Related Trade Workers (ISCO 71-74), Plant and Machine Operators (ISCO 81-83) and Labourers in Mining, Construction, Manufacturing and Transport (ISCO 93).
4 The sample of the EWCS is representative of persons in employment (employees and self-employed). The sampling design had the following stages: stratification of primary sampling units (PSUs) according to region and urbanisation level; random selection of starting addresses within each PSU; and a ‘random walk’ procedure for the selection of the household. The response rate was 0.48 and was calculated as the proportion of completed interviews to the total number of eligible cases. Three types of weighting were applied to the data in order to enhance the representativeness of the results: a selection probability weighting; a non-response (or post-stratification) weighting; and a cross-national weighting in order to be able to do cross-national estimations. For the quality report on the 4th EWCS (see Petrakos Agilis, M., 2007).
5 For the exact wording of the questions upon which the measures are based, see the Annex; Table A1.
6 The factor method used is multiple correspondence analysis. In order to group the individuals, Ward’s method of hierarchical clustering is used on the basis of the factor scores, or the coordinates of the observations, of the first two factors which account for 59% of the total variance of the data set. See the Annex for a graphical presentation of the factor analysis.
7 The figures are taken from, Statistics in Focus, ‘Population and Social Conditions’, 6/2006, Eurostat.
8 The labour market expenditure figures are taken from Eurostat’s Labour Market Policy data base. Total expenditures are defined as the sum of active and passive expenditure targeted at one of the following: the unemployed, the employed at risk of becoming unemployed and inactive persons who would like to enter the labour market but are disadvantaged in some way. Active measures include expenditure on training, job rotation and job sharing, employment incentives, direct job creation and start-up incentives. Passive measures include expenditure on out of work income maintenance and early retirement.
9 We are well aware that simple correlations are primitive when it comes to sorting out causalities. In the paper in the Cambridge Journal of Economics (Lorenz and Lundvall, 2010) we pursue a more sophisticated analysis based upon multilevel regression techniques. The results obtained there coincide with those presented below.
10 The figures are available on Eurostat’s electronic data base. The Labour Force Survey lifelong learning module distinguishes between formal, non-formal and informal or self-learning. Formal life-long learning is defined as that provided by the degree-conferring institutions of the formal educational system. Non-formal education and training refers to all forms of taught learning, including that provided by employers, that occurs outside the formal degree-conferring educational system. Informal learning refers to self-taught learning including the use of printed materials and on-line computer based learning. For the Eurostat quality report on the lifelong learning module of the LFS, see: http://circa.europa.eu/irc/dsis/employment/info/data/eu_lfs/LFS_MAIN/Adhoc_modules/2003/ExplanatoryNotes/Final_Report_Ahm2003_EN.pdf
11 We focus on life-long-learning in this analysis rather than on initial vocational training because the further education and training opportunities provided through systems of life-long-learning potentially concern all occupational categories. Apprenticeships or other forms of non-enterprise-based initial vocational training tend to be specific to particular occupations and hence the level of development of these forms of training are less relevant for measuring the overall breadth of the educational and training system in a nation and the extent to which value is placed on the acquisition of job-related skills for employees regardless of their occupational category or level of education.
Comments on this publication